7
$\begingroup$

I'm following the third recipe of this answer to estimate the Shannon entropy of my samples using histograms. My expectation was, increasing the sample size should lead to a better estimation of the true entropy. To test that, I sampled from a Gaussian distribution $N(0, \sigma^2)$ with known entropy $H(X) = 0.5[1 + \log(2\pi \sigma^2)]$:

import numpy as np
from scipy.stats import entropy # by default in natural log
import matplotlib.pyplot as plt

sigma = 2
H0 = 0.5*(1 + np.log(2*np.pi*sigma**2)) # theoretical value in nats

Hs = []
ns = np.logspace(2,6,5, dtype=int)
for n in ns:
    X = np.random.normal(0, sigma, size=n)
    nbins = int(n/20)  # <--- This is causes divergence, read UPDATE 2
    hist, bin_edges = np.histogram(X, nbins, density=True)
    Hs.append(entropy(hist)) # will be automatically normalized to sum to 1

plt.plot(ns, Hs, '-x', label='estimation')
plt.hlines(H0, ns[0], ns[-1], linestyle='--', color='k', label='exact H')
plt.legend()
plt.yticks(np.arange(11))
plt.xscale('log')
plt.xlabel('num samples')
plt.ylabel('sample entropy')

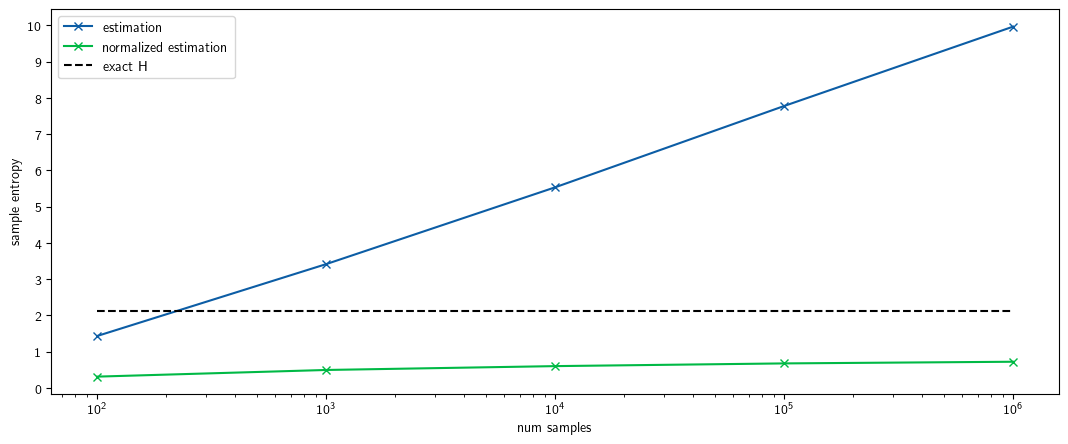
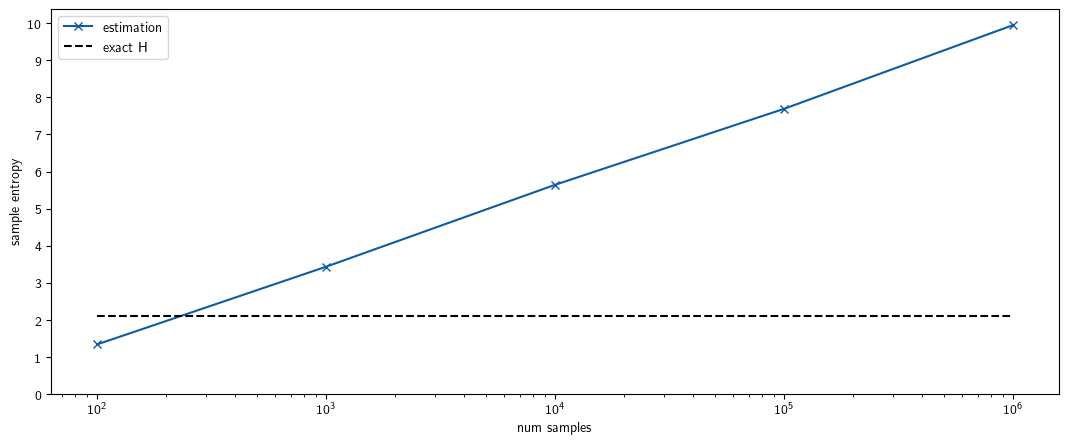
To my surprise, they diverge:

Enter image description here

Am I missing something very simple?

I found a relevant question that is concerned about the case where the probability distribution is either "peaked" or "flat". The upshot of the most voted answer is that one has to normalize the entropy by $\log n$ where $n$ is the number of samples. Although I find this normalization sensible, I still observe an offset between the theoretical value and the estimation:

plt.plot(ns, np.array(Hs)/np.log(ns), '-x', label='normalized estimation') # normalized

enter image description here

What causes this discrepancy?

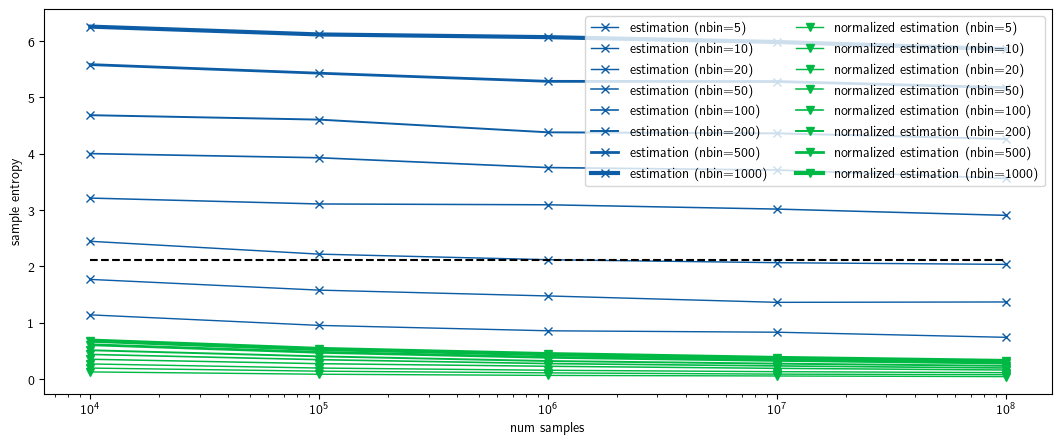
As @sextus-empiricus noted below, scaling the number bins with the sample size leads to a coarse density estimation. In fact, fixing the number of bins, resolves the divergence. However, no matter what number of bins one chooses, there's still some offset between the estimated (normalized or non-normalized) entropy and the theoretical value, as you can see below:

Enter image description here

What is the reason behind this gap? The curve displacement by nbins clearly suggest that there's a relationship between the two, but I found the reason elusive.

$\endgroup$
0

1 Answer 1

5
$\begingroup$

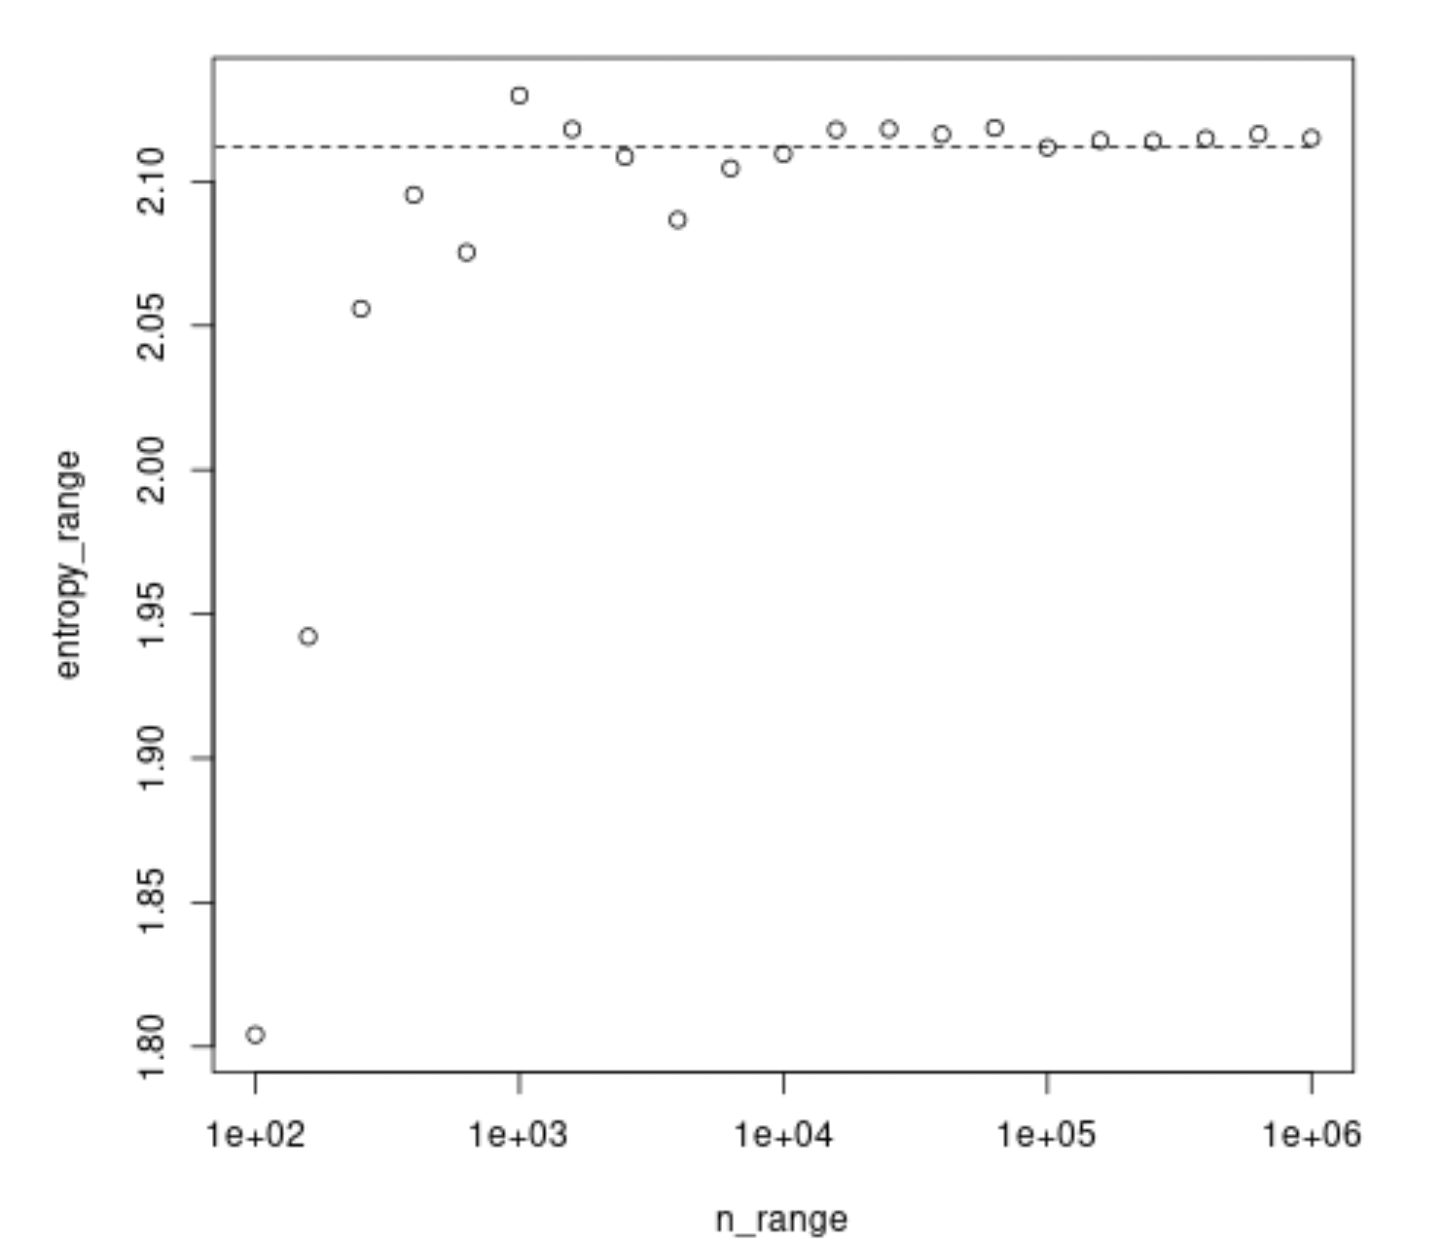
Here is an image that I made with the R-code below. The computation is with n-bins = 50.

There is in this simulation also an offset but smaller and with more bins I get a smaller offset. This might be because you approach the values of a discretized normal distribution and not the values of a continuous normal distribution. So one should not expect the same.

For small sample sizes there is lower entropy. This might be counter intuitive because one would imagine a small sample to be more variable and more chaotic. But, the state described by the histogram of a small sample is a very particular state and has more order than the average of many different samples. The increase of the sample size can be seen as blending multiple states and that creates an average that blends out to a smooth histogram, a histogram that looks like a more homogeneous sample.

example simulation

set.seed(1)
n_range = 10^seq(2,6,0.2)
entropy_range = c()
n_bins = 50

for (n in n_range) {
  x = rnorm(n, mean = 0, sd = 2)
  h = hist(x, breaks = n_bins, freq = 0)
  p = h$density[h$density > 0]
  bin_size = h$mids[2]-h$mids[1]
  entropy = -1*sum(log(p)*p*bin_size) 
  entropy_range = c(entropy_range, entropy)
}


plot(x= n_range, y= entropy_range, log = "x")
lines(x= c(1,10^6), y= c(1,1)*(0.5*log(8*pi)+0.5), lty = 2)

A tricky part is that the computation of entropy is different for continuous distributions

$$\int f(x) \log \left( f(x) \right) \text{d} x \approx \sum_{k = 1}^{n_{bins}} f_k \log \left( f_k \right) \cdot \text{bin_size}$$

When you just apply the bin probabilities $p_k = f_k \cdot \text{bin_size}$ and use the formula for discrete distributions then you get a different values.

$$\sum_{k = 1}^{n_{bins}} f_k \cdot \log \left( f_k \right) \cdot \text{bin_size} \neq \sum_{k = 1}^{n_{bins}} f_k \cdot \text{bin_size} \cdot \log \left( f_k \cdot \text{bin_size} \right) = \sum_{k = 1}^{n_{bins}} p_k \cdot \log \left( p_k \right)$$

You will be wrong with a factor $\log(\text{bin_size})$ and that explains the different curve displacements shown in your second edit.

In short: entropy is the expectation of the logarithm of the probability mass function or the probability density function $E[\log p(X)]$ and $E[\log f(X)]$. Problems arrise when we mix those formulas and functions.

$\endgroup$
5
  • $\begingroup$ That's right. Fixing the number of bins solves the problem of divergence. Yet, the offset persist. (I'll update my question to include this). $\endgroup$
    – arash
    Commented Nov 2, 2023 at 12:28
  • $\begingroup$ Thanks for posting this! I could reproduce your result once I set nbins=20, but not for other values of nbins. Please see my last figure, I just updated it. At this point, I'm not sure how nbins effects the gap between theoretical and estimated entropy values. $\endgroup$
    – arash
    Commented Nov 2, 2023 at 13:03
  • 1
    $\begingroup$ It is funny that in my previous version of the post I made the mistake discussed at the end, but because I used 20 bins which made binsizes of 1, it didn't make an influence. The weird discrete step that I observed there was due to the bin-sizes changing when the sample size increases. $\endgroup$ Commented Nov 2, 2023 at 13:42
  • $\begingroup$ Thank you very much for this update! Sure enough, adding $\log (\text{bin_size})$ fixes the gap. $\endgroup$
    – arash
    Commented Nov 2, 2023 at 13:54
  • 1
    $\begingroup$ @arash and the divergence that you had earlier was due to bin_size scaling with sample size. With the correct formula for entropy you can let the n_bins increase with n. $\endgroup$ Commented Nov 2, 2023 at 13:59

Your Answer

By clicking “Post Your Answer”, you agree to our terms of service and acknowledge you have read our privacy policy.

Not the answer you're looking for? Browse other questions tagged or ask your own question.