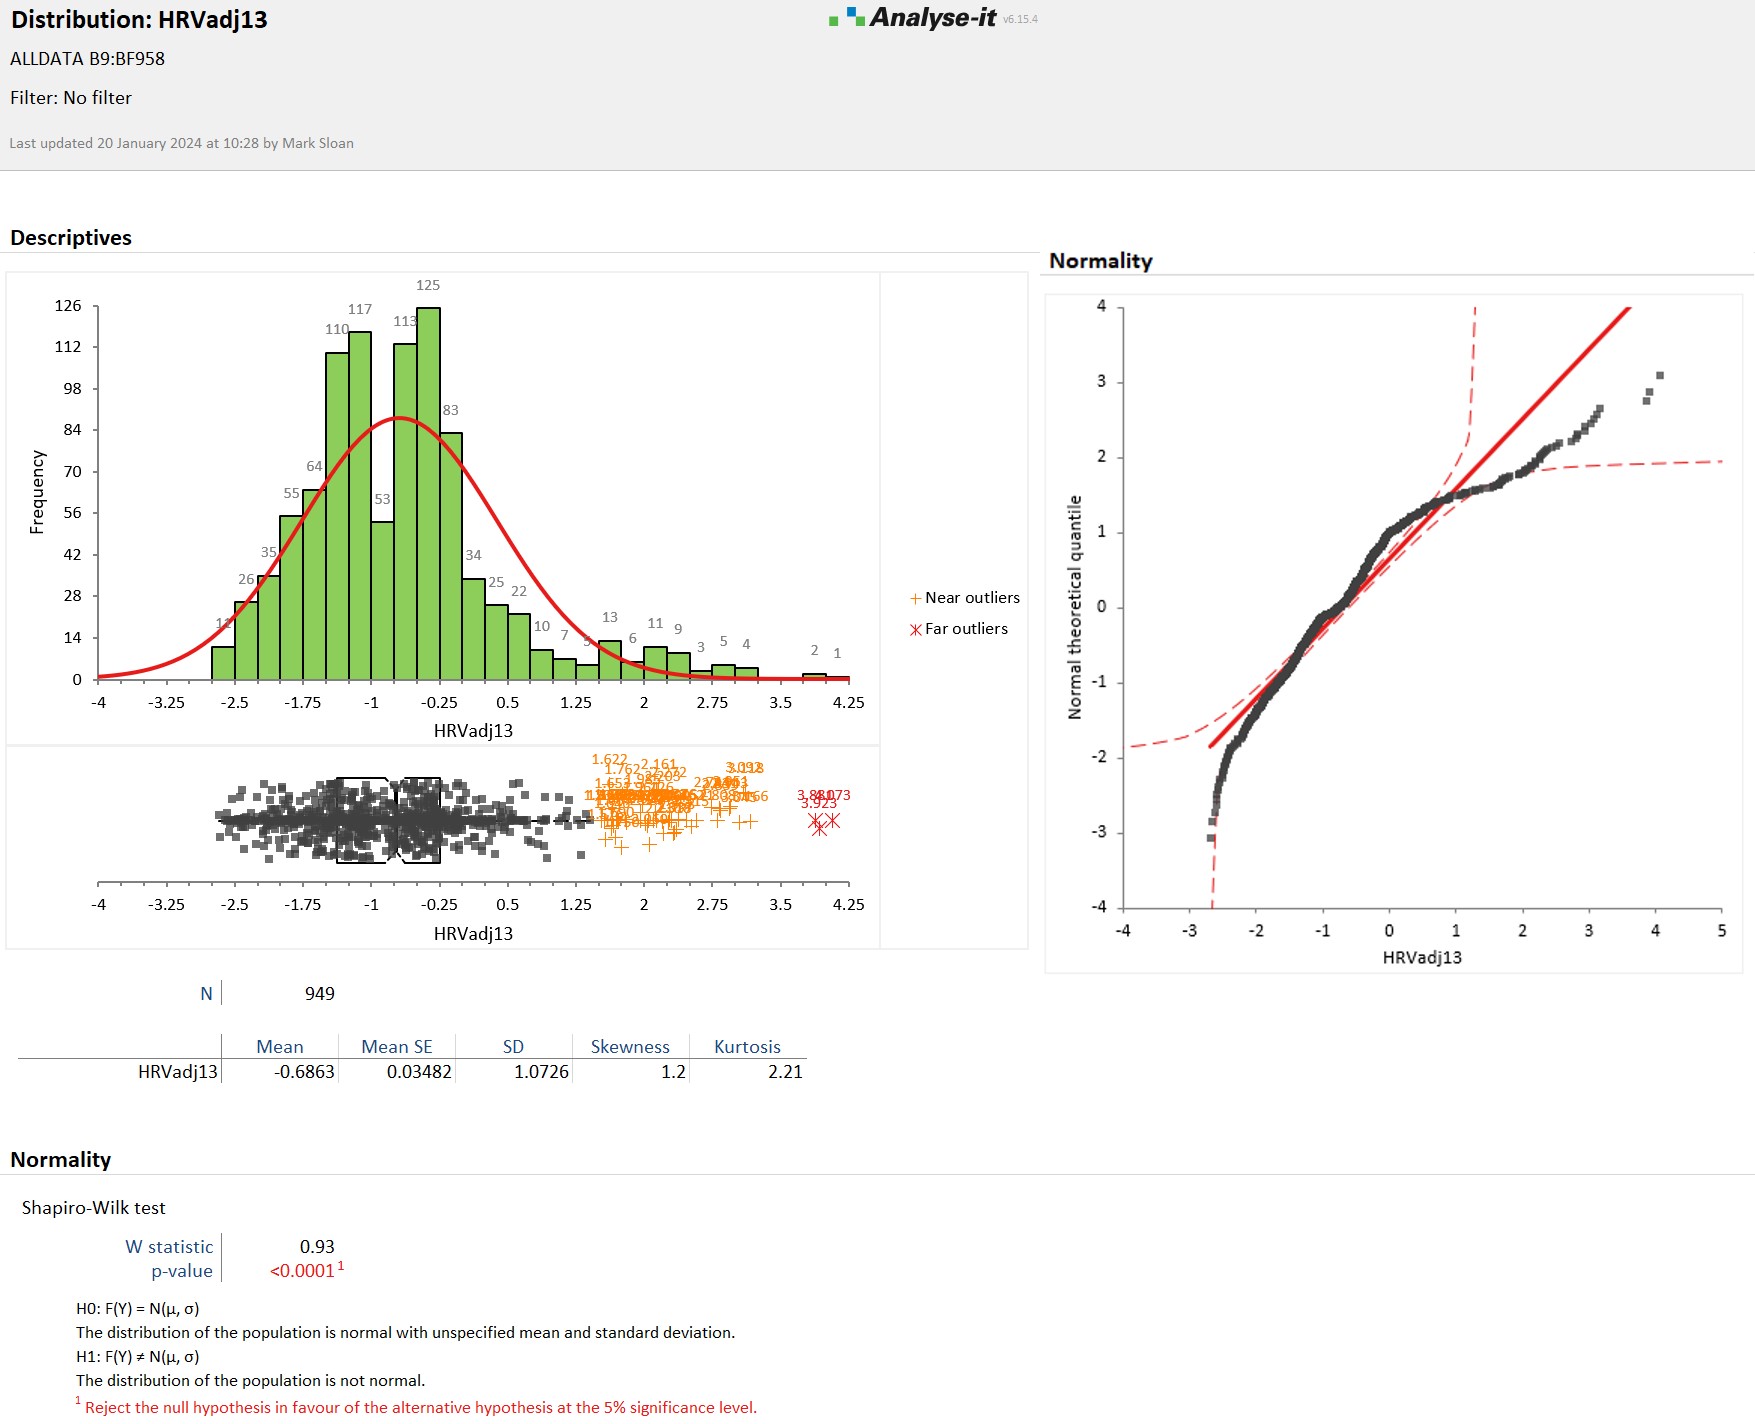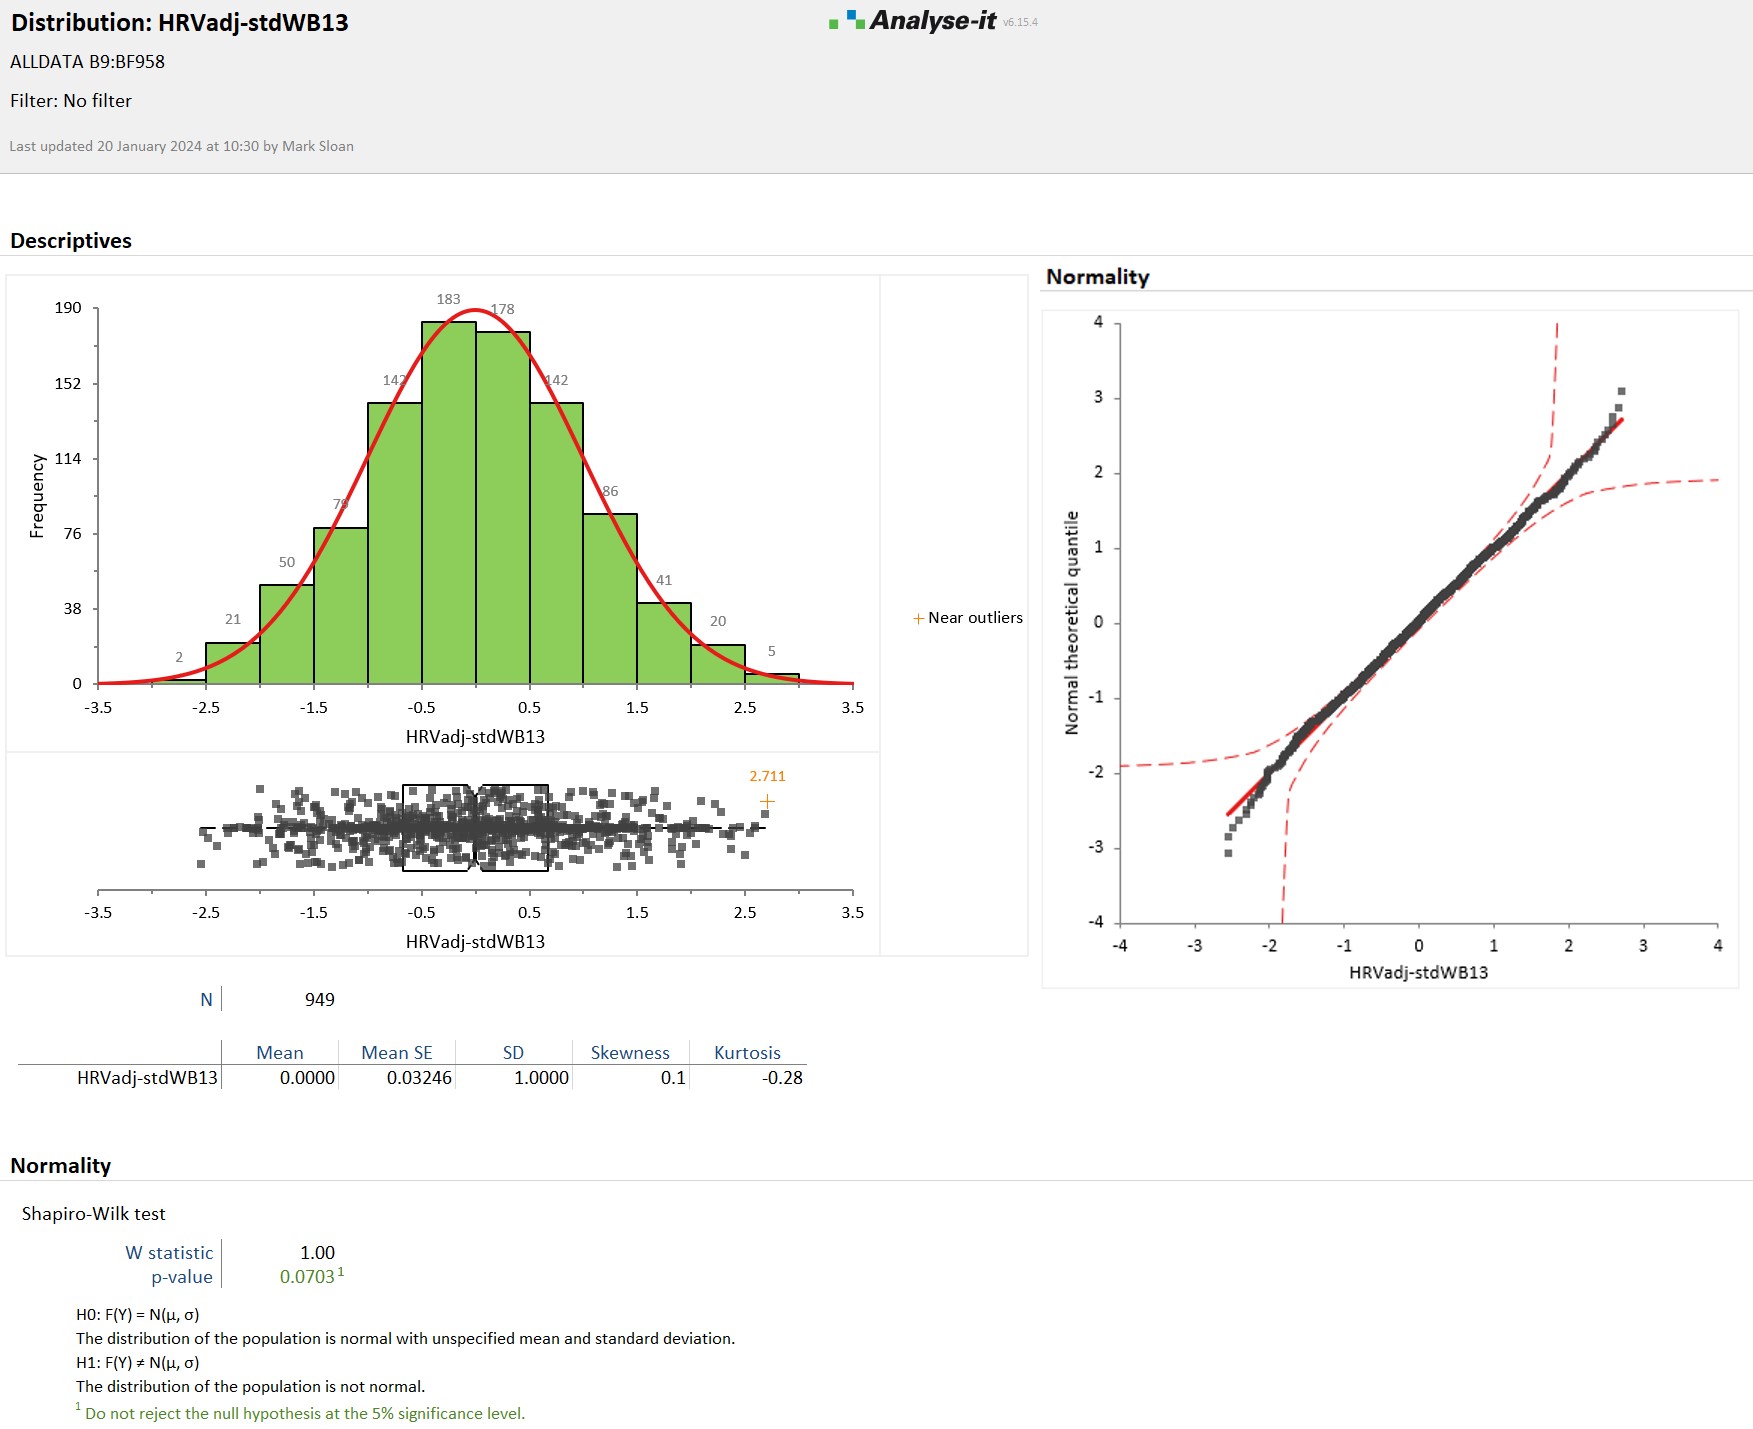
 I have a dataset with over 900 cases. I performed a Q-Q Plot on the non-standardized HRV data (dependent variable), and the points formed a wavy curve indicating it does not follow a normal distribution. The accompanying histogram is right-tailed, and the box plot shows several outliers. The study design is repeated measures (within-subjects), where each subject is exposed to 13 scenes (treatments). I first standardized each subject's 13 responses within the subject (13 HRV scores standardized), and then grouped each subject's standardized results with 73 total subjects (73 x 13 = 949 data points). This resulted in data with a MEAN = 0, but STD = 0.96. I then "re-standardized" this data, which resulted in MEAN = 0 and STD = 1. The resulting Q-Q Plot is now a straight line with a few stragglers on the ends, the histogram is symmetrical, and the box plot shows only one near outlier. Furthermore, the Shapiro-Wilk normality hypothesis test no longer rejects the null hypothesis of the distribution of the population as normal. I realize as a dependent variable a normal distribution is unnecessary, but I would like to standardize to facilitate comparison with other physiological and psychological dependent variables I also have in the study. The questions: Is this a valid way to standardize DV values such that each participant's individual heart physiologies (some more consistently higher values, some more consistently lower values) are accounted for equally within the 73-participant group (such that no one individual's scores have more influence than another individual), and could the resulting normal distribution be a valid result? Two other alternatives suggested in feedback include 1) Adding a control for physiology, or 2) Using a Multilevel model, which I think would mean the Individual 13 responses = LEVEL 1, and the entire group of 73 participants together (949 responses) = LEVEL 2?
-
3$\begingroup$ Welcome to CV, Mark. Whatever you did is not what is usually undertood as "standardizing" and it certainly is not just the recentering and rescaling you imply. It looks like the entire distribution might have been transformed to make it approximately Normal, but I cannot see any information concerning what was actually done. // What is a "DV dataset"?? // Why are you concerned about the distribution in the first place? $\endgroup$– whuber ♦Commented Jan 20 at 18:02
-
1$\begingroup$ Those operations make it impossible to carry out or interpret most comparisons. You need to explain what you're trying to accomplish. $\endgroup$– whuber ♦Commented Jan 20 at 18:18
-
2$\begingroup$ Instead of standardizing you should control for the physiology. But again, you are describing your calculations without explaining what you are trying to learn. Although some things can be learned about heart rate variability after this selective standardization process, many other things cannot, because essential information is lost in the standardization. $\endgroup$– whuber ♦Commented Jan 20 at 18:37
-
1$\begingroup$ "Restandardizing between" is not very clear, but it doesn't seem to make sense. Also, GLMs do not assume that any variable is normally distributed. As an aside, a) You are using terms in non-standard ways and this is confusing a lot of us and b) Relying on Excel for data analysis flashes a red light, to me. Finally, I think you need some sort of multilevel model as you have repeated measures. If this is important research I would consider hiring a consultant. $\endgroup$– Peter FlomCommented Jan 21 at 0:14
-
1$\begingroup$ I won't vote to re-open this as I think the comments already include the essence of an answer. The short reply to _ Is this a valid way to standardize DV values?_ is to me: No. That throws away really important information if I understand correctly. $\endgroup$– Nick CoxCommented Jan 23 at 14:50
1 Answer
This makes no sense to me.
Standardization in the sense of (value $-$ mean) / SD is just a linear scaling and will itself make no difference to how close any variable is to a normal reference distribution.
Something else is going on here.
The evidence needed is
The normal quantile plot for the original variable with the code you used to produce it.
Code showing how you standardized that variable.
The normal quantile plot for the standardized variable with the code you used to produce it.
The over-arching question is why do you think that this outcome variable needs to be normally distributed? What do you intend to do with it?
If you can post your data, that would be ideal. It could be for example that the data can be posted compactly as a table.
-
$\begingroup$ I have added more information and comments above to help with your response. Thank you! $\endgroup$– Mark S.Commented Jan 20 at 18:00
-
$\begingroup$ This was an early answer, and the only one to date, but mostly superseded by revisions and comments. I won't try to revise or expand it, but it doesn't deserves any more upvotes, thanks! $\endgroup$– Nick CoxCommented Jan 23 at 14:52
