2
$\begingroup$

Suppose I run a poisson regression with yearly death count as outcome:

$\log \mu_{t}=a + \beta_{ti} \kappa_{ti} + offset$

$\mu_{t}$ refers to the number of death at time $t$; $a$ refers to intercept; $\kappa_t$ refers to age-group $i$ at time $t$. Noted that I have stratified the age into several groups, i.e. 0-4;5-9;10-14...etc

My question is that: Can I claim that the mortality rate of age group $i$ at time $t$ is $exp(\beta_{ti})$?

$\endgroup$
2
  • $\begingroup$ Where is the population size? A rate is the number of events in a time interval over the population size during the interval. $\endgroup$ Commented Feb 2 at 11:36
  • $\begingroup$ $Offset$ refers to population size $\endgroup$
    – doraemon
    Commented Feb 3 at 12:08

1 Answer 1

2
$\begingroup$

If you run an additive Poisson regression model, then rate $\lambda_{ti} = a + \beta_{ti}$ will be the rate among the age group. However, you have a multiplicative model so the rate will be $\lambda_{ti} = \exp(a + \beta_{ti})$. The rates predicted via additive vs. multiplicative can be very different. My experience has been that the additive gives better approximation of rates than multiplicative, which is mostly used to determine relative risk (RR) or excess relative risk (ERR). Multiplicative Poisson regression is typically the default model used by most software. Some packages don't run additive models for Poisson.

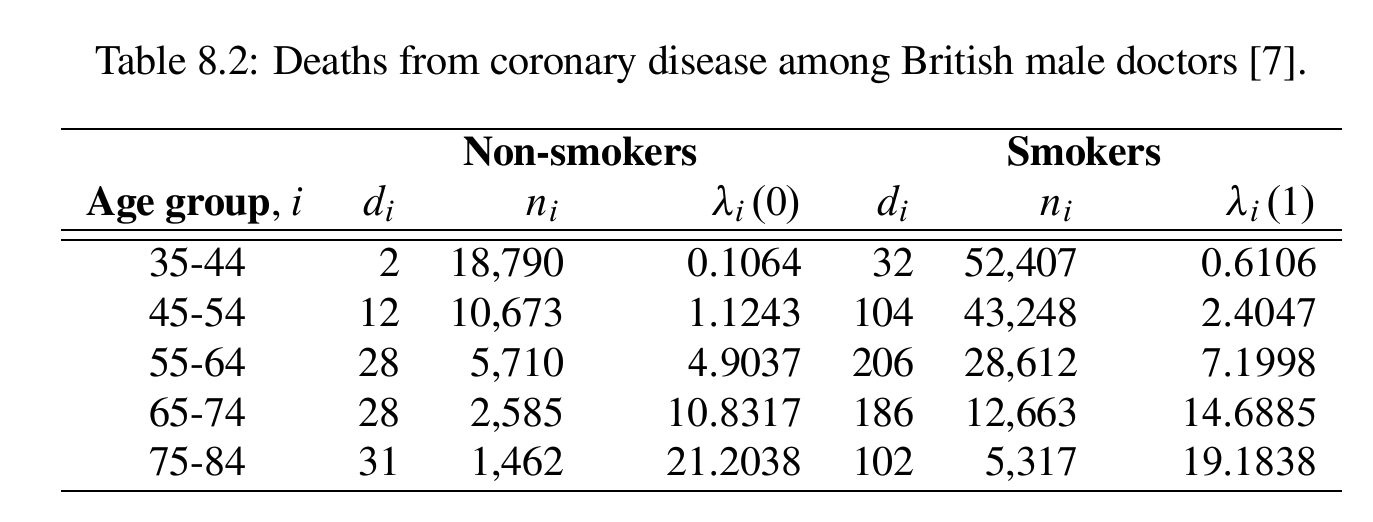
Below is an example dataset called the British Smoking Doctors dataset. There's a smoking and non-smoking group, and $\lambda_0$ is the age specific rate (cases/person-years) for non-smokers multiplied by 1,000, and $\lambda_1$ is the age-specific rate among smokers multiplied by 1000. (thus, person-years is divided by 1,000 before input).
enter image description here

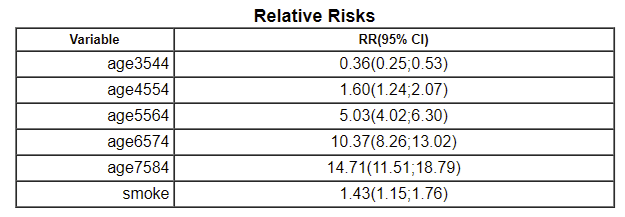
Below are the coefficients from a multiplicative model when a constant term was not used, in order to get a rate estimate for every age group -- i.e., there's no $a$ like in your model:

enter image description here

Below are the coefficients from an additive model:

enter image description here

Notice how the estimated coefficients from an additive model sit right on top of the rates listed in the table. Not true for the multiplicative model. This is why I stated the additive model returns estimates closer to the original rates.

The multiplicative model is used to estimate the relative risk of smoking, which is 1.43=exp(0.355). So age-specific rates increase by 1.43 for smoking. For additive, the rates increase by addition of 0.59.

Even when you exponentiate coefficients from the multiplicative model, the estimated baseline rates are not as close at those represented by additive coefficients:
enter image description here

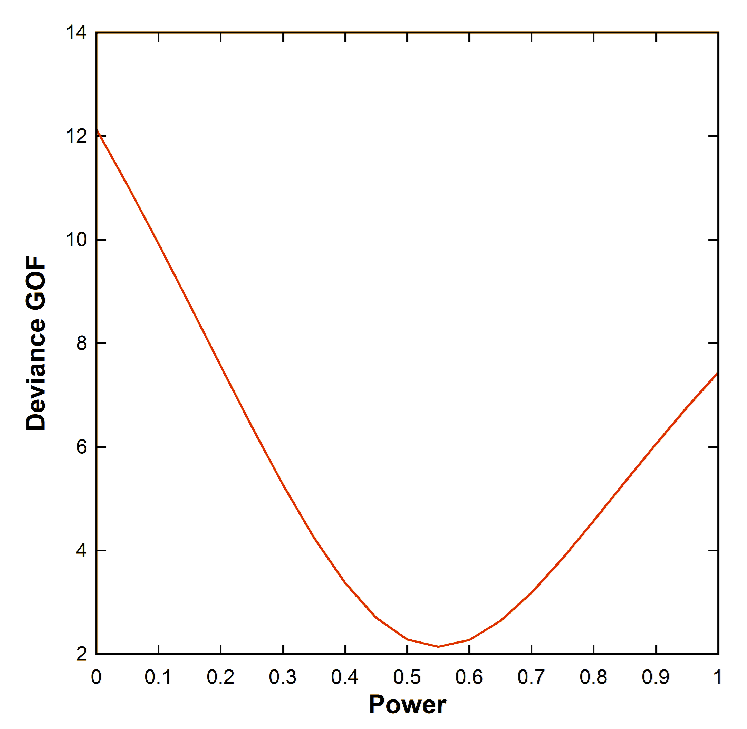
As far as the appropriate model, if you run a geometric mixture model, where purely additive is $\rho=1$, and purely multiplicative is $\rho=0$

enter image description here

you'll find that $\rho=0.55$ results in the lowest deviance goodness-of-fit. This is shown in the plot below:
enter image description here

References:

R. Doll, A.B. Hill. Mortality of British doctors in relation to smoking: Observations on coronary thrombosis. Nat'l. Cancer Inst. Monogr. 19:205--268, 1966.

C.R. Muirhead, S.C. Darby. Modelling the relative and absolute risks of radiation-induced cancers. J. Royal Stat. Soc. A. 150:83--118, 1987.

$\endgroup$
8
  • $\begingroup$ Sorry for late reply. I forgot to add exponential symbol before $\beta_{ti}$, but your information about multiplicative and additive models are very useful, thank you! $\endgroup$
    – doraemon
    Commented Feb 4 at 8:40
  • 1
    $\begingroup$ I think the difference between multiplicative and additive models of Poisson regression is the link function. I guess the reason that some statistical packages do not run the additive model is that there is no effective way to fit non-canonical link function. $\endgroup$
    – doraemon
    Commented Feb 4 at 8:46
  • 1
    $\begingroup$ Yes, it's the link function. Packages that don't run additive Poisson simply haven't designed the code to handle additive - which requires several calculational changes to estimates that are not related to the link function. $\endgroup$
    – wjktrs
    Commented Feb 4 at 19:32
  • 1
    $\begingroup$ See modified answer with observed and predicted estimates of rates from multiplicative and additive models. $\endgroup$
    – wjktrs
    Commented Feb 4 at 20:02
  • 1
    $\begingroup$ Forgot to say, I never use a constant term for Poisson regression, because I want e.g. a rate coefficient for each specific age-group. If you use a constant term, you can only get 4 rate coefficients - not 5, like the ones all the output tables above. When your $a$ is used, an age-group coefficient is the rate difference between all subjects and those in the group considered. So in the above outputs, the coeff for age7584 would be the delta of rate difference between subjects who are age74-84 vs everyone else. $\endgroup$
    – wjktrs
    Commented Feb 5 at 14:33

Your Answer

By clicking “Post Your Answer”, you agree to our terms of service and acknowledge you have read our privacy policy.

Not the answer you're looking for? Browse other questions tagged or ask your own question.