0
$\begingroup$

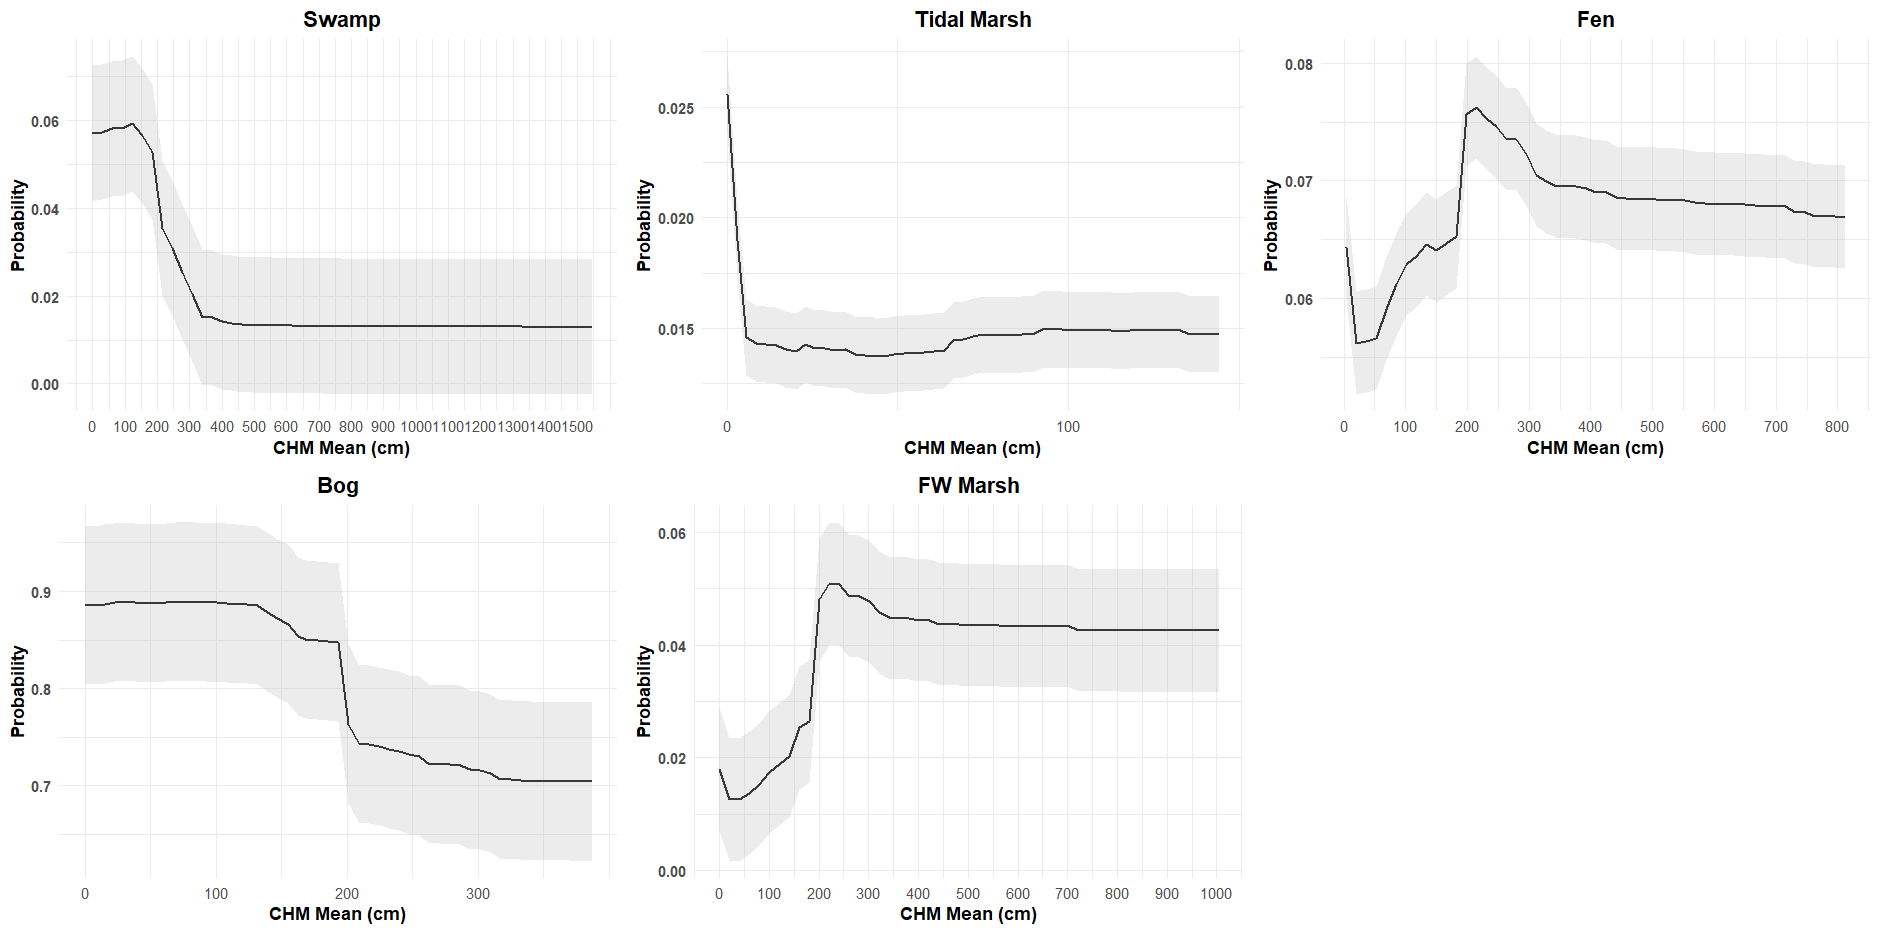
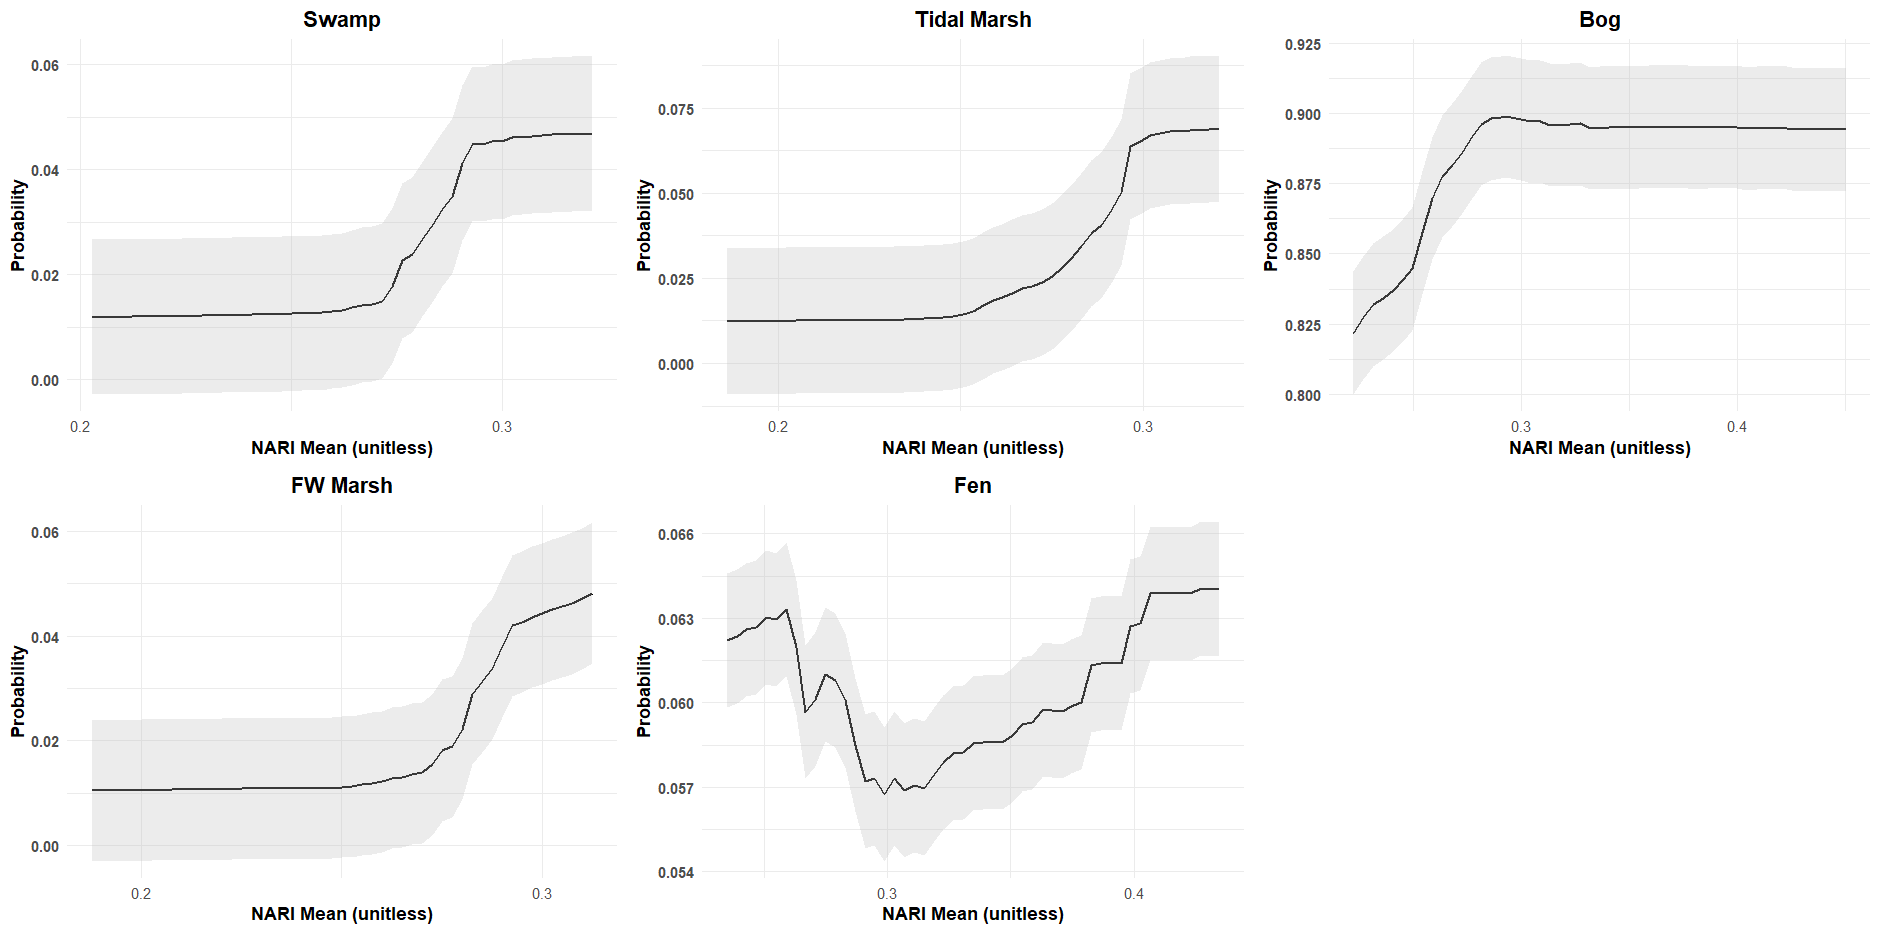
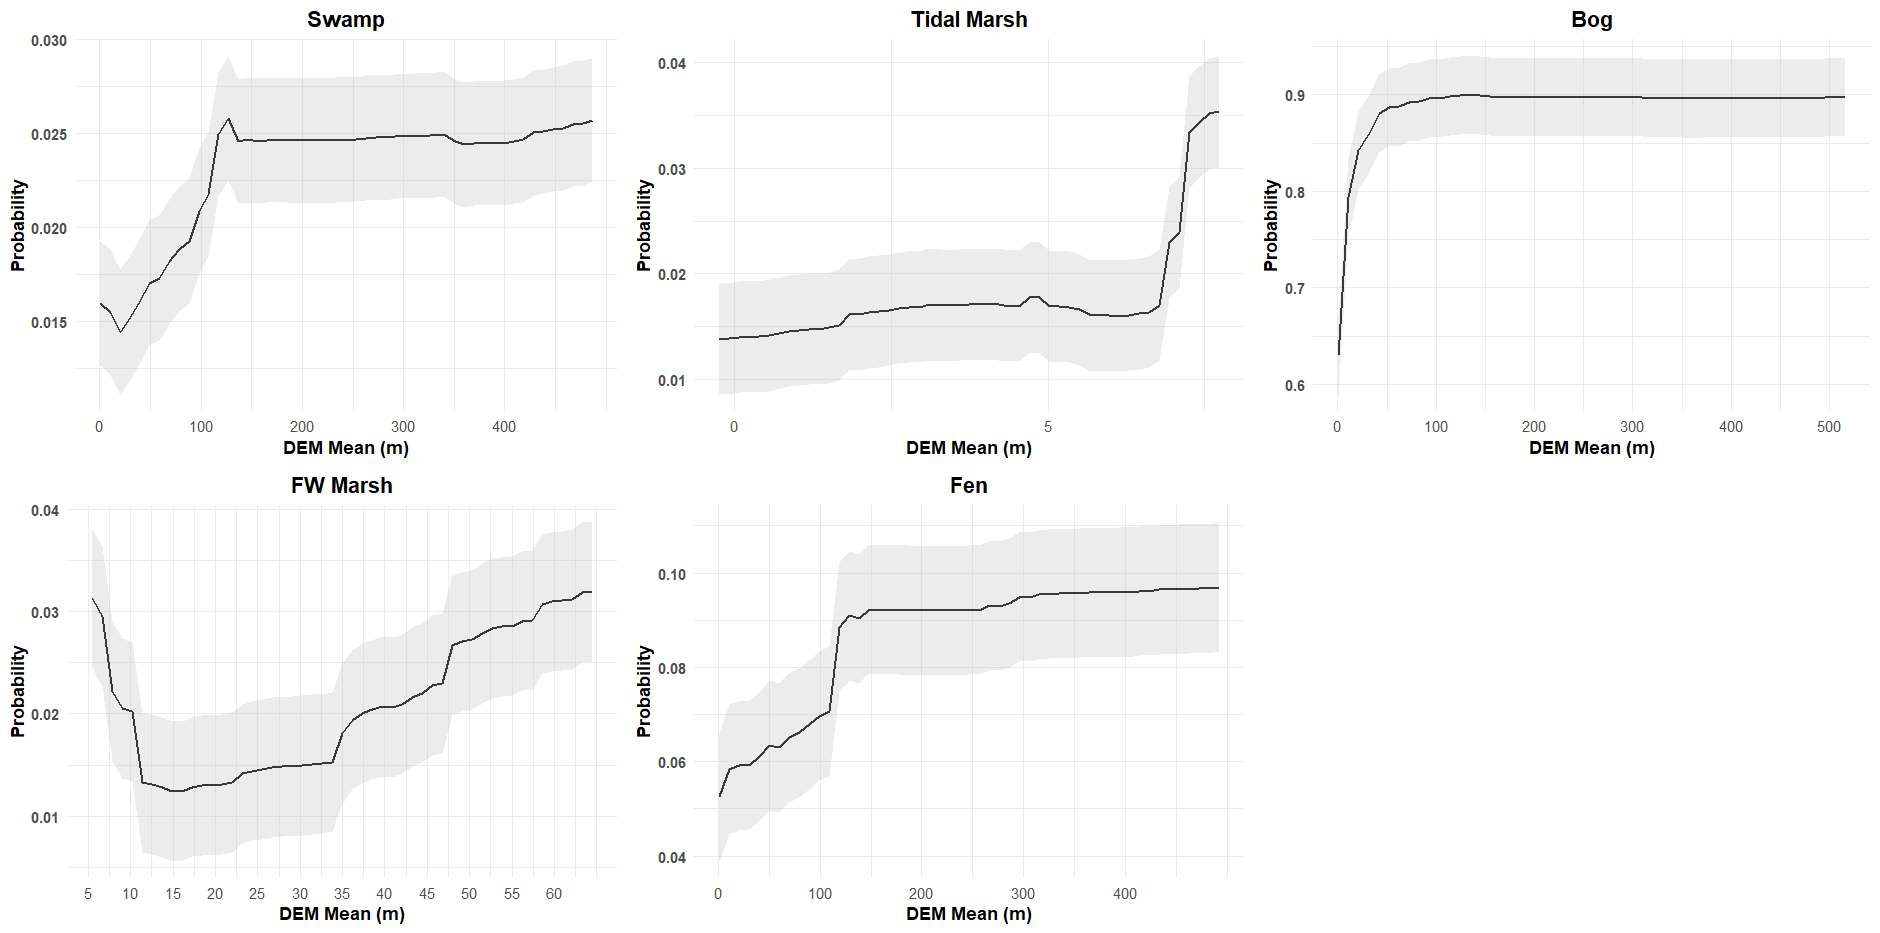
I have created several Partial Dependence Plots (PDP) for some of the top variables in my RF model. Overall, the plots seem to make sense; however, for the 'Bog" class, the probability for all variables analyzed goes up to around 0.9 probability, while for the other variables, the probability is significantly less (e.g. 0.02).

I understand that the probability will change depending on the class, and a predictor variable may have more importance in one class than another. However, the high probability for all bog classes has me questioning the data. I would appreciate any feedback and ideas on troubleshooting approaches (if necessary). enter image description here enter image description here enter image description here
$\endgroup$
5
  • $\begingroup$ If you exclude that class from your RF, and then re-train it, how does the validation score change? $\endgroup$ Commented Feb 13 at 15:30
  • 1
    $\begingroup$ @EngrStudent, it dropped like 0.3% so is around 92% OA. $\endgroup$ Commented Feb 13 at 16:00
  • $\begingroup$ This suggests that the overall learning is not compromised by that label. 0.3% of 92% can be run-to-run training variation. If you reran it 100 times with different seeds, you might easily get that. I was initially thinking you might have something that allows the learner to "index" (basically create a false-hash) so it looks like it has near perfect learning, but it is just memorizing and has terrible generalization. $\endgroup$ Commented Feb 14 at 4:21
  • 1
    $\begingroup$ I only ran the model twice. I found out what I did wrong. I was having issues making PDPs for each class, so I created subsets of my data per class from the rf model and then made the PDPs. This explains why I had funky results. I rewrote my script and used the which,class argument and got the results I desired and what makes sense. Thanks for your input! $\endgroup$ Commented Feb 15 at 2:46
  • 1
    $\begingroup$ So write up a clean if brief and effective answer for posterity. $\endgroup$ Commented Feb 15 at 14:13

1 Answer 1

0
$\begingroup$

I only ran the model twice. I found out what I did wrong. I was having issues making PDPs for each class, so I created subsets of my data per class from the rf model and then made the PDPs. This explains why I had funky results. I rewrote my script and used the which,class argument and got the results I desired and what makes sense.[]

-- John Gallop

$\endgroup$

Your Answer

By clicking “Post Your Answer”, you agree to our terms of service and acknowledge you have read our privacy policy.

Not the answer you're looking for? Browse other questions tagged or ask your own question.