It's my understanding that the proportional hazards assumption means that the effect of a covariate on the hazard rate (or the instantaneous risk of an event) remains constant over time. In practice, this means that the risk of an event for one group should be proportionally higher (or lower) than the other group throughout the entire study period...
I am currently testing two Cox proportional hazards regression models, both of which are identical apart from their follow-up times (5 years and 10 years, respectively). The results of the Schoenfeld test for each model are shown below:
5-Year Model Schoenfeld Test Results:
| Variable | Chisq | df | p-value |
|---|---|---|---|
| Depression Level | 0.757 | 2 | 0.685 |
| Variable 2 | 5.524 | 2 | 0.0632 |
| Variable 3 | 4.514 | 2 | 0.105 |
| Variable 4 | 11.104 | 2 | 0.004 |
| Calendar Year | 1.492 | 1 | 0.222 |
| Age | 7.278 | 1 | 0.007 |
| Sex | 0.625 | 1 | 0.429 |
| Education Level | 5.889 | 1 | 0.015 |
| Employment Status | 22.739 | 4 | <0.001 |
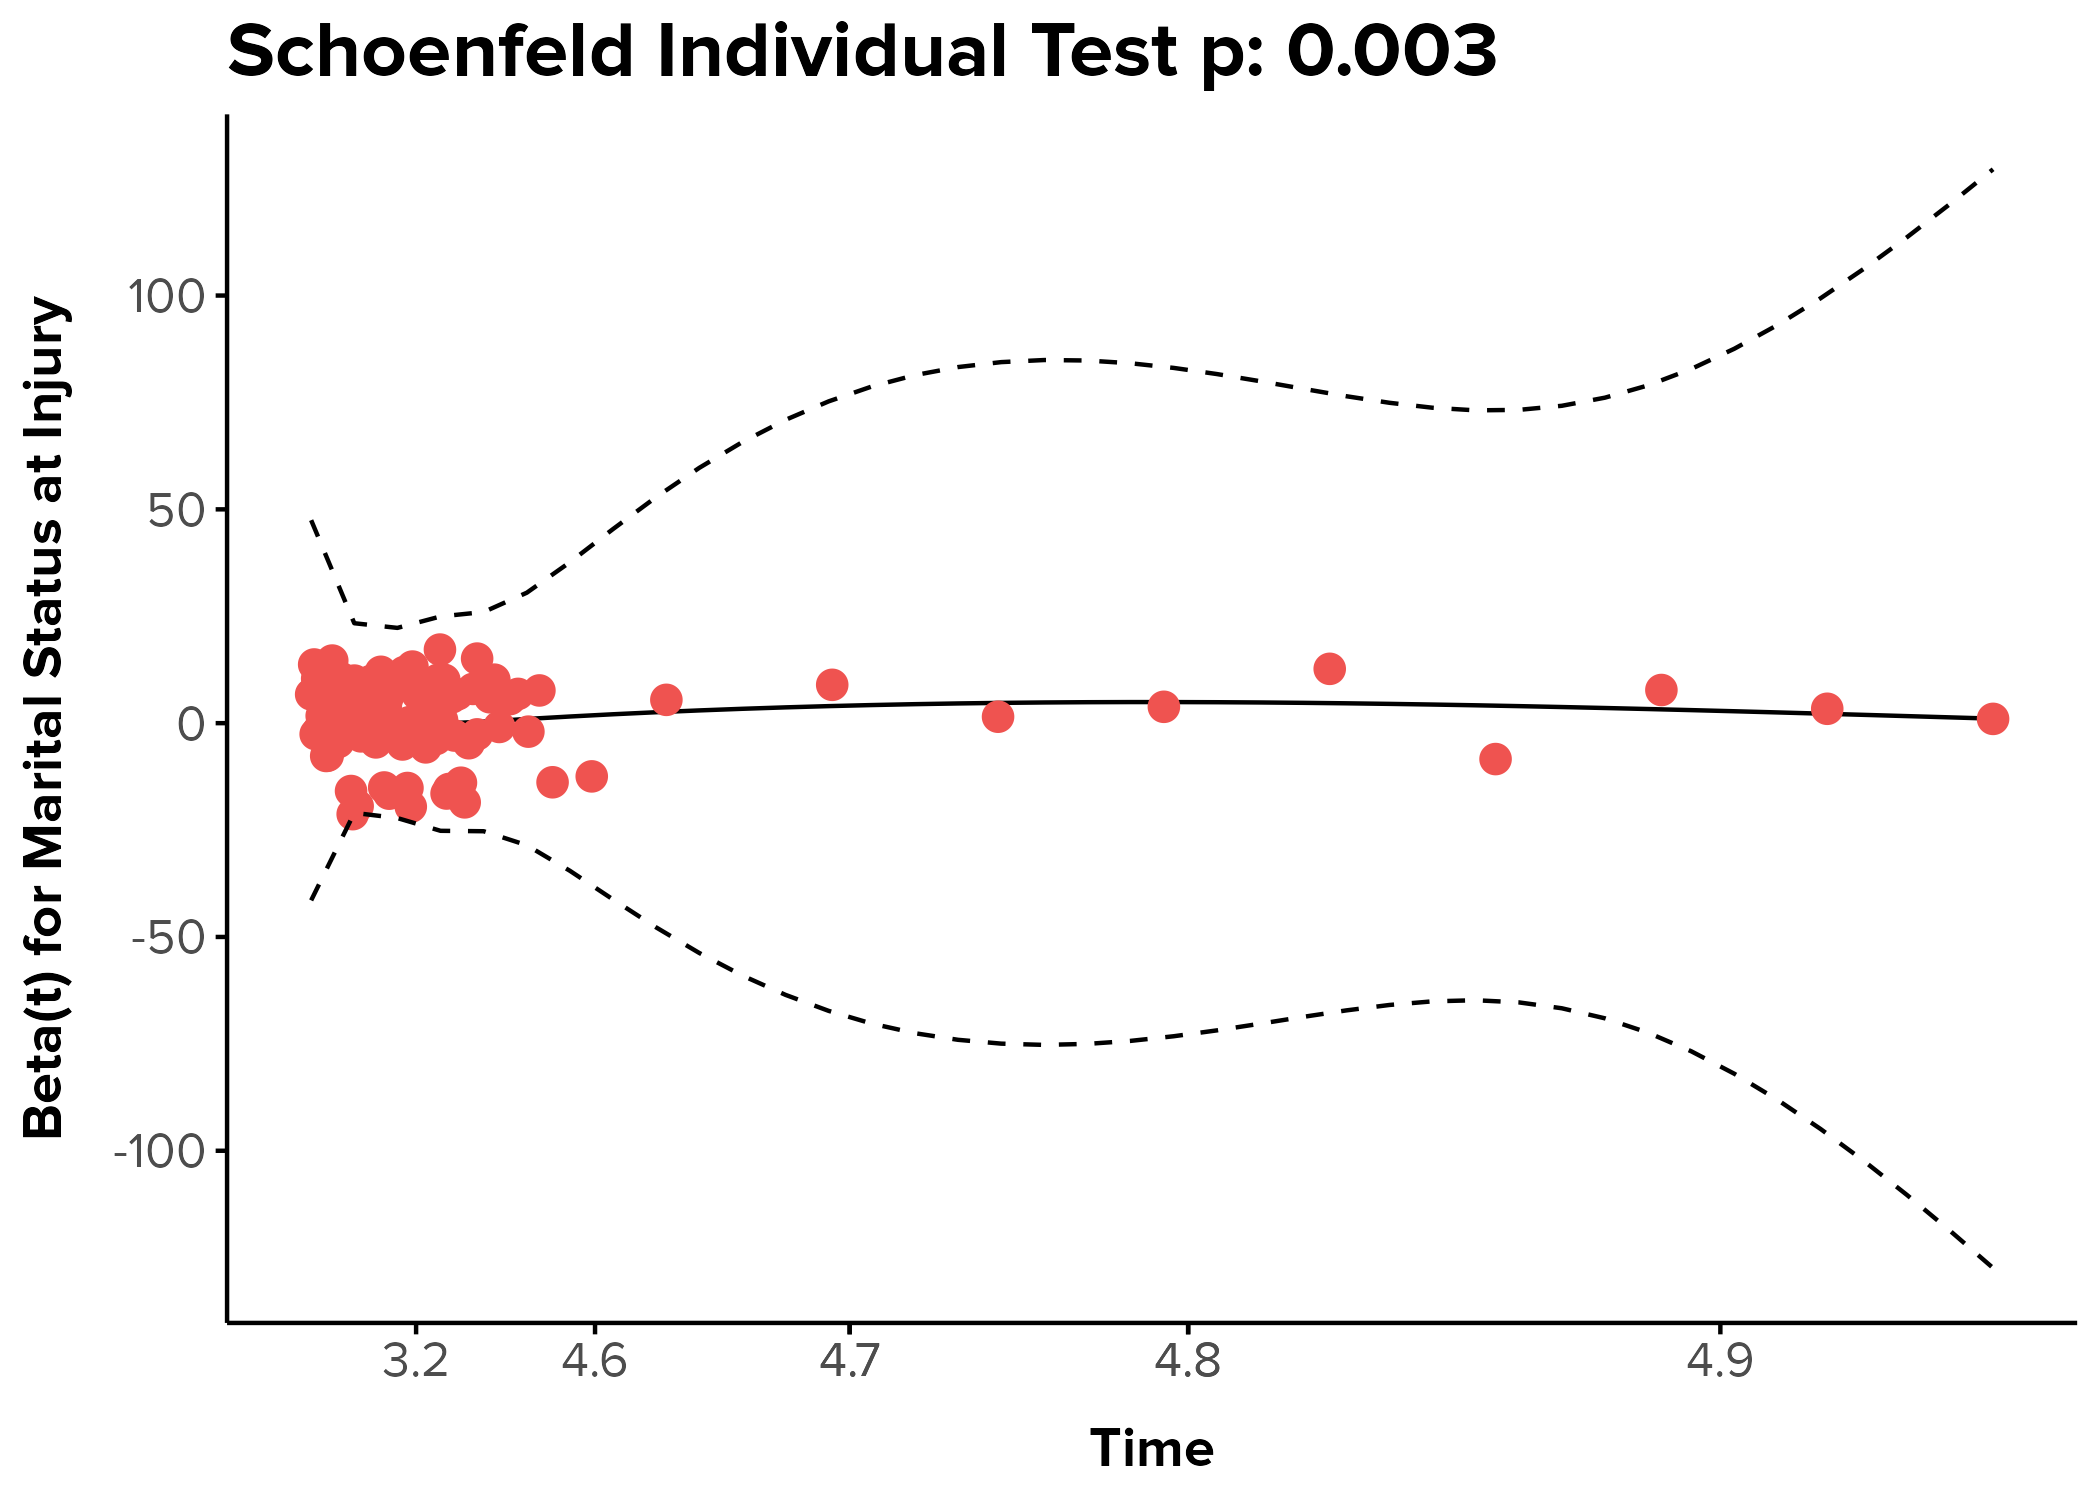
| Marital Status | 13.914 | 3 | 0.003 |
| Medicaid Status | 0.777 | 1 | 0.378 |
| Mechanism | 26.795 | 3 | <0.001 |
| Variable 13 | 21.838 | 1 | <0.001 |
| Variable 14 | 21.566 | 1 | <0.001 |
| Variable 15 | 12.990 | 1 | <0.001 |
| GLOBAL | 31.6802 | 26 | 0.001 |
10-Year Model Schoenfeld Test Results:
| Variable | Chisq | df | p-value |
|---|---|---|---|
| Depression Level | 6.4271 | 2 | 0.040 |
| Variable 2 | 1.2341 | 2 | 0.540 |
| Variable 3 | 2.0940 | 2 | 0.351 |
| Variable 4 | 0.0656 | 2 | 0.968 |
| Calendar Year | 1.5297 | 1 | 0.216 |
| Age | 3.7158 | 1 | 0.054 |
| Sex | 0.3735 | 1 | 0.541 |
| Education Level | 0.0380 | 1 | 0.845 |
| Employment Status | 6.7776 | 4 | 0.148 |
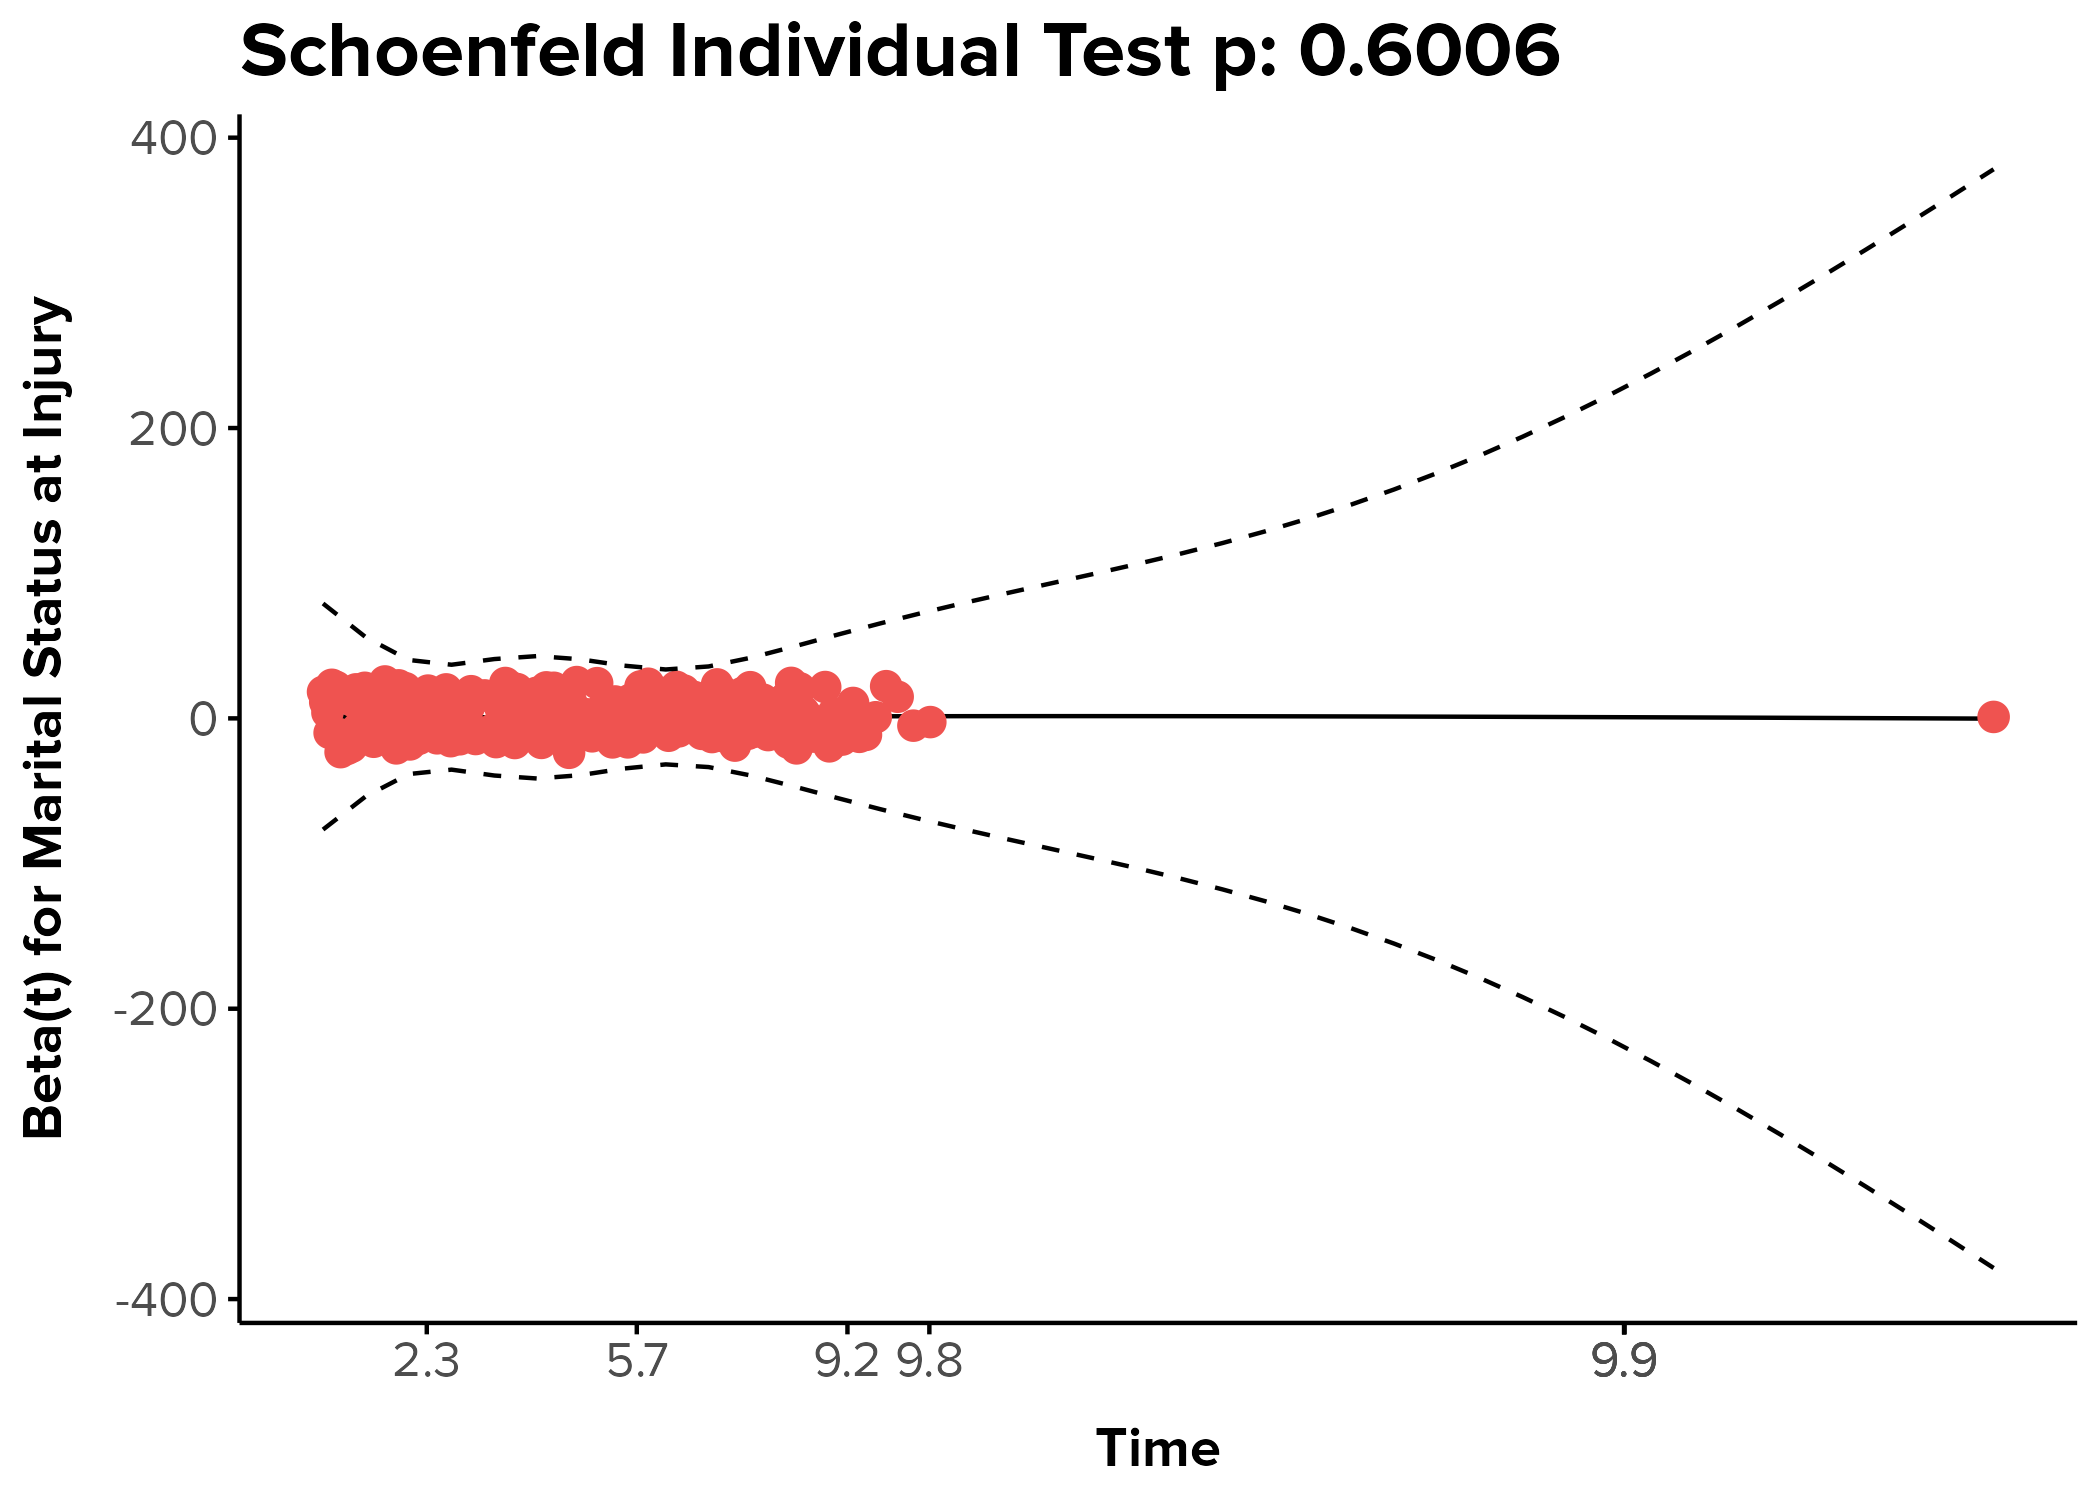
| Marital Status | 1.8665 | 3 | 0.601 |
| Medicaid Status | 0.1716 | 1 | 0.679 |
| Mechanism | 5.0215 | 3 | 0.170 |
| Variable 13 | 0.7751 | 1 | 0.379 |
| Variable 14 | 0.0739 | 1 | 0.786 |
| Variable 15 | 0.2949 | 1 | 0.587 |
| GLOBAL | 31.6802 | 26 | 0.204 |
Are these results contradictory? That is, is it guaranteed that a covariate that violates the PH assumption in a model with a shorter follow-up time should necessarily violate the PH assumption in a model with a longer follow-up time? In the example above: Is it possible for multiple (9/15) covariates to violate the PH assumption in a Cox regression model that follows participants for 5 years but not for the same model with a 10-year follow-up period?
What could this mean about the set of violating covariates in the 5-year model? Does it mean that the effects of the violating predictors on the hazard of death change more rapidly over the initial 5 years compared to later years? Does it mean, for example, that age and education level have strong initial effects that diminish over time?
Additional Information (as requested by EdM):
This analysis originates from a retrospective cohort study with follow-up interviews collected at 1, 2, 5, and 10 years from the date of injury. The "start time" in the present analysis is the Year 1 interview date. (This was chosen as the start time because the main covariate of interest,
depression_level, was not collected until the first follow-up interview.)The datasets for the 5- and 10-year models contained 1,228 and 1,245 total participants, respectively. There were 113 events in the 5-year model (9.2% mortality rate) and 219 events in the 10-year model (17.6% mortality rate).
We sought to evaluate the 5- and 10-year follow-up periods separately as these are specific time points of interest within the literature on our cohort study (which collects follow-up data at 1, 2, 5, and 10 years after study enrollment) as well as in the field more generally.
The x-axis is measured as time (in years). It's the number of years from the first (Year 1) follow-up interview until either censorship or death.
As requested, here are the Schoenfeld residual plots for a predictor, marital_status, that failed PH in the 5-year model but not the 10-year model:
5-year Schoenfeld residual:
10-year Schoenfeld residual:


cox.zph()? What do Schoenfeld residual plots look like for a predictor that failed PH in the first model but not in the second? $\endgroup$