1
$\begingroup$

Background: I am studying the customer satisfaction scores from a random sampling of customers at a technology firm. I have a collection of 13 data points which consist of averages of customer satisfactions scores per year over a course of 13 years. Below is a snap shot of the years, yearly satisfactions scores, and sample size. The scoring metric ranges from 1-5, where 1 = terrible service, 5=excellent service.
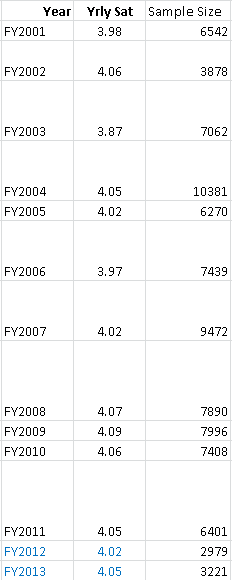
enter image description here

Problem: I would like to determine if the increase in the yearly satisfaction scores are statistically significant.

Methods Tried: I've done some googling and found the following link: "Detecting Significant Changes in Your Data", where it recommends using the T Distribution.

Whenever I follow the step-by-step approach given by the author I obtain the following output,

(where I average the csat scores from 2001-2003 as mu, and then average the scores from 2004-2013 as x-bar. Then I took the standard deviation of x-bar and got "s". "n" is the total number of data points since 2004, and student's t-value is calculated as t=|xbar – mu|/(s/squareroot(n)). Then p is calculated in excel as =TDIST(student t-value, degrees of freedom, tail), where those values are: 6.58, 9, and 1 respectively)).

Output

I obtain a value less than 5%, thus it appears that the change in csat scores is significant from 2004-2013.

I have several questions about this:

Questions:

  1. Is this the correct method to use to show statistical significance in my change of csat scores? If not then what is a correct way? I should note that I have only an elementary understanding of stats, so I am limited to comfortably doing calculations in excel.
  2. What is the difference between using 1-tail & 2-tails applied to my problem? Which one should I use & how do I determine that? If I use either 1-tail or 2-tails how do I determine if my % is statistically significant, would it still be the "less than 5%?" (assuming alpha=.05)
  3. What is the best way to formalize my null hypothesis given this problem?
  4. Why does the author (in the link) calculate p (t-distribution function in excel) using the value of "p" instead of "n"? Also, how is degrees of freedom/the tail(s) accounted for in the tdist function?
$\endgroup$
10
  • $\begingroup$ Do you have the raw data (not the means)? Why did you choose 2003 as a cutoff point? $\endgroup$
    – Peter Flom
    Commented Jan 13, 2014 at 18:47
  • $\begingroup$ Hi Pete, thanks for taking the time to look over my question. I do not have access to the raw data prior to 2003 nor access to the raw data in general at this time. This seems to be due to the complications in the way that the raw data was reported and filtered throughout the years or the overall complexity in breaking down the raw data from the current data sources. It's an issue I don't have much control over. The only raw data I have access to is incomplete. It's the Q1 csat scores from Nov '11 - Nov '13 listed here: i.imgur.com/0NNcMqo.png. Looks like the means are the most complete $\endgroup$
    – Quaternary
    Commented Jan 13, 2014 at 20:17
  • $\begingroup$ Then, unfortunately, I think there is very little you can do. $\endgroup$
    – Peter Flom
    Commented Jan 13, 2014 at 20:40
  • $\begingroup$ Ok lets say the results are statistically significant. What does this mean? As you can clearly see, the satisfaction scores barely change at all. Would .1 of a difference on a 5-point scale even represent anything? $\endgroup$
    – Behacad
    Commented Jan 13, 2014 at 20:40
  • $\begingroup$ @PeterFlom What sort of data do we need to measure statistical significance? What sample size do we need? Why is there little we can do with the current data? I can potentially dig deeper & get raw data but it may take a few days. $\endgroup$
    – Quaternary
    Commented Jan 13, 2014 at 20:49

3 Answers 3

1
$\begingroup$

Since this is from a survey, you'd need to know the design of the survey and population size in order to property calculate the variance estimates. You may need to make a finite population correction depending on the population size and you should determine what type of "random sampling" was done. Was it stratified? A cluster random sample? All of these will impact your variance estimates and could ultimately change your conclusions since the variance estimates are used to calculate your statistical tests.

$\endgroup$
1
$\begingroup$

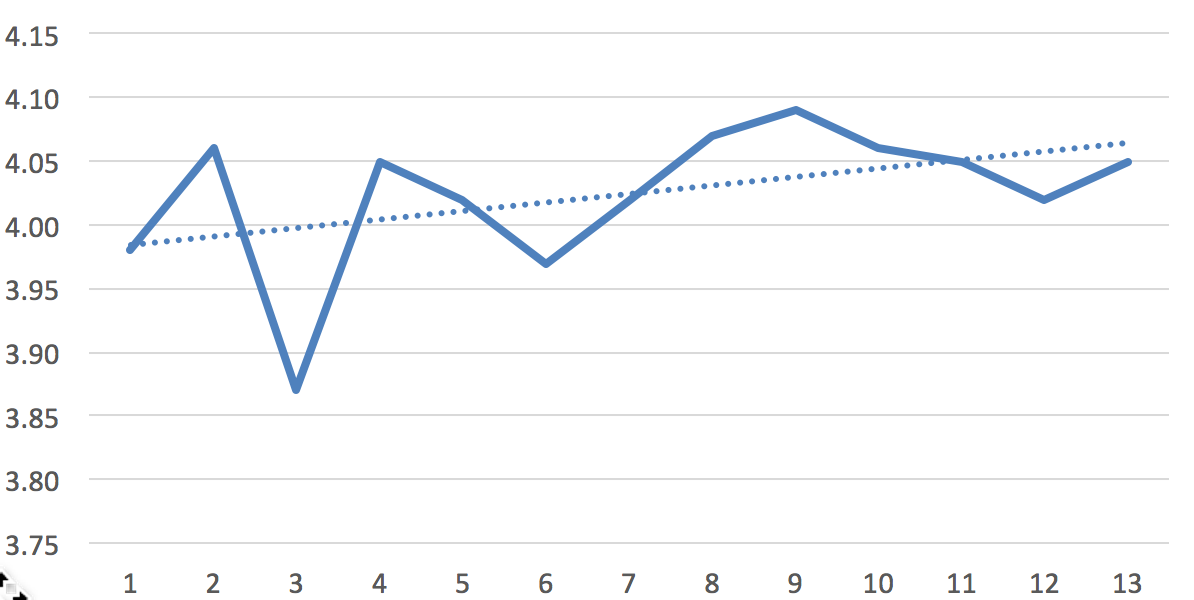
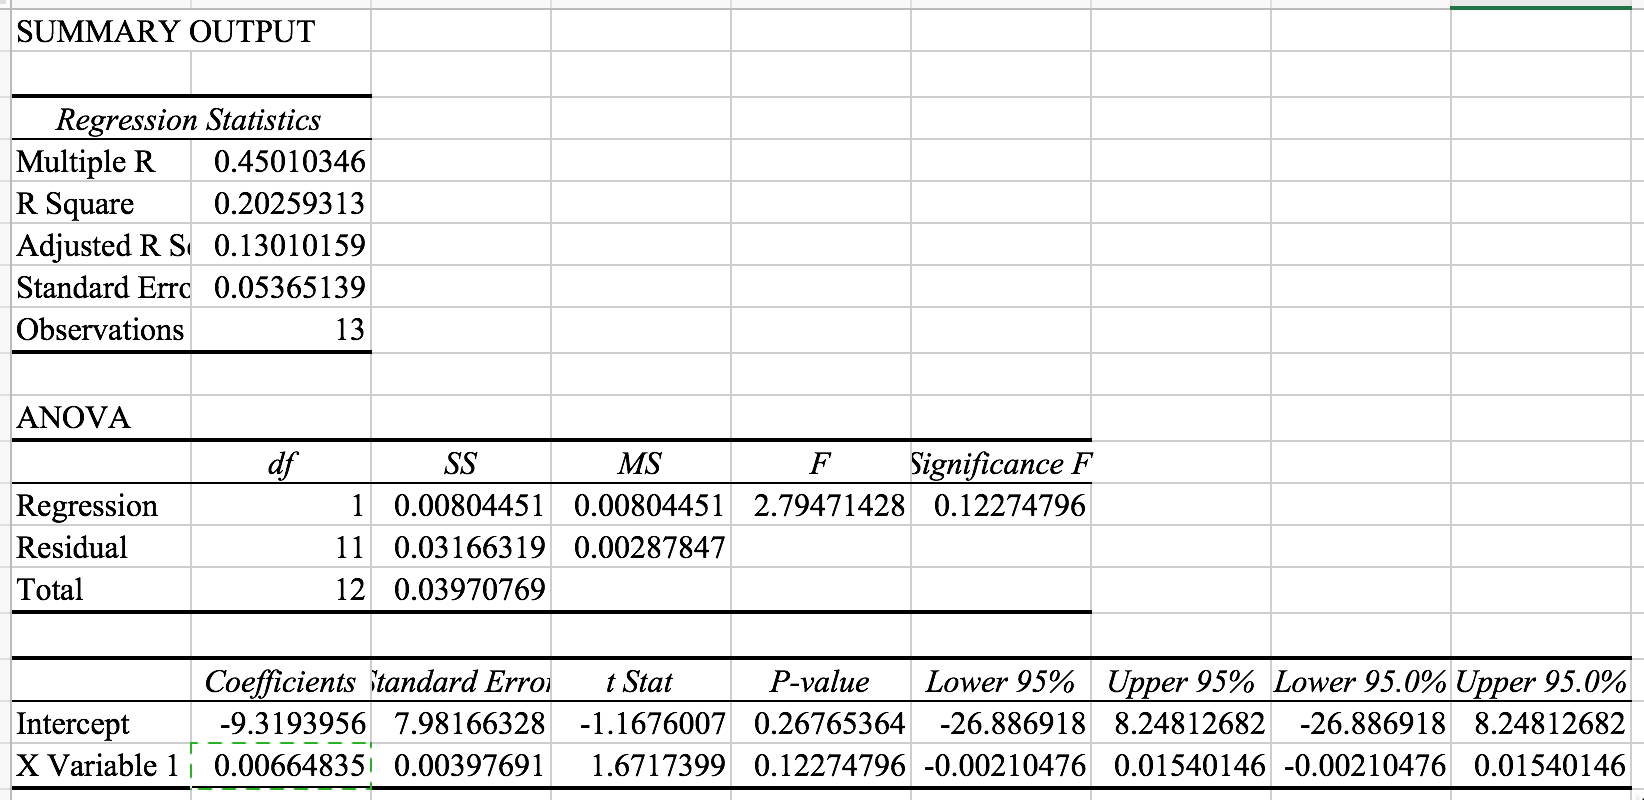
If what you want is to look for a long term steady increase you may want to do a simple regression of SAT vs YEAR. Excel will do just that once you install the data analysis add-on. A test on the slope will tell you if the average yearly increase is statistically significant (I assume you are aware of the many criticisms of statistically significance).

The trend is mildly significant (p=0.12) and the regression slope is small (0.0066 points per year).

Probably not a very rigorous analysis but likely enough for a managerial report powerpoint (!)

enter image description here

enter image description here

$\endgroup$
0
$\begingroup$

1) As already stated, you should really consider all the raw data for this analysis to detect the noise of the yearly surveys and get a true idea of the spread of the data.

2) You would best use a one tail t-test because you are looking for an increase in customer satisfaction. A two tail t-test has twice the p-value of a one tail test (p-value from each tail) but your example has already applied a one tail test.

3) Your null hypothesis would be: Customer satisfaction scores have not changed over the monitoring period

4) This question isn't clear, A p-value is the likelihood of getting a observation more extreme then the observed test statistic. This is calculated based on the test statistics (6.58); the degrees of freedom, in this case, (n-k) 10 - 1 = 9 where k = the number of groups; and finally the number of tails (1 explained above)

Hope this helps / provides some clarity

$\endgroup$
3
  • $\begingroup$ Thanks for the response. You answered my questions nicely. I have a few additional questions though. Would the t-distribution test (as in my example) still be appropriate for a "sufficiently" large data set (i.e. at least 30 or more data points)? If so, how should I partition the data in the "before change" and "after change" category to measure statistical significance? E.g. say I have 120 scores total and I want to partition those scores in the "before change" and "after change" sections to see if the "after change" is statistically significant. Hope that makes sense. If not I'll clarify. $\endgroup$
    – Quaternary
    Commented Jan 14, 2014 at 14:16
  • $\begingroup$ T distributions are an approximation of the normal distribution for small sample (n<=30) therefore a sample size n>30 would be best dealt with a normal distribution. it sounds like you want to do a one tail test to see if the current scores are significantly different from a nominated threshold level. You need to nominate this threshold level (maybe 3.97) then test for an increase in customer satisfaction score $\endgroup$
    – Marine-Max
    Commented Jan 16, 2014 at 4:21
  • 1
    $\begingroup$ "Nominating" a "threshold" would be erroneous. The value of $3.97$ is based on the three earliest years; it cannot be treated as a number. When its standard deviation (and very low degrees of freedom) are allowed for, the t-statistic becomes much lower and will be non-significant by most standards. It becomes even lower when one accounts for the fact that the data were partitioned based on the data values themselves. $\endgroup$
    – whuber
    Commented Jan 13, 2015 at 20:29

Your Answer

By clicking “Post Your Answer”, you agree to our terms of service and acknowledge you have read our privacy policy.

Not the answer you're looking for? Browse other questions tagged or ask your own question.