1
$\begingroup$

If I generate normally distributed data and then use this data to estimate the parameters of a normal distribution using, say, maximum likelihood I would expect the estimated standard deviation to be close to the true standard deviation given enough data. If I instead use this normally distributed data to estimate the parameters of a t distribution with a fixed DF the scale does not approach the true sd. There should, however, exist a functional relationship between the SD of the data and the scale of the t-distribution. I haven’t manage to figure this relationship out so my question is:

What is the relation between the estimated standard deviation of a normal distribution and the scale of a t distribution when applied to the same (truly) normally distributed data?

I've done some numerical simulations, where I generated normally distributed data, fitted a normal and a t with a fixed DF and looked at the ratio between the estimated SD of the normal and the scale of the t. It definitely looks like there is a relation, but it would be nice to have a formula for this :)

Here is the simulation in R code:

library(MASS)

scale_ratio <- sapply(seq(1, 10, 0.1), function(df) {
  x <- rnorm(9999, sd=100)
  fitdistr(x, "normal")$estimate[2] / fitdistr(x, "t", df=df)$estimate[2]
})

plot(seq(1, 10, 0.1), scale_ratio, xlab="DF", ylab="normal SD / t scale")
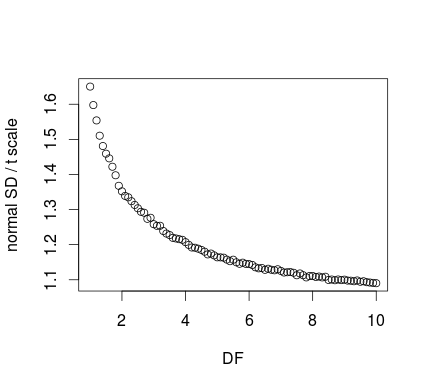
scale vs sd

Edit: 1

A possible use for the transform I'm looking for would be when using a t-distribution as a robust alternative to the normal distribution when modelling data. The t distribution is a consistent estimator of the mean of normally distributed data with the added benefit that it will be more robust against contamination/outliers in the data. As shown above, the t-distribution will not be a consistent estimator of the SD but it would be neat if it could be made consistent by transforming the scale somehow.

Edit 2:

One way of transforming the scale of the t distribution so that it becomes more similar to the SD of the normal data is by taking the Interquartile range (IQR) of the estimated t distribution and then dividing the IQR by 1.349 which, if the IRQ would have come from a normal distribution, would have resulted in the SD of that normal. This transform feels a bit like a hack to me and does not make the discrepancy go away completely as seen below.
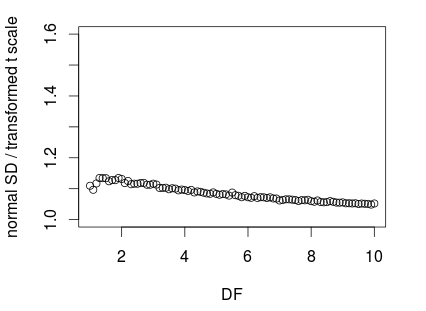
enter image description here

Another possibility would be to use the SD of the t-distribution, instead of the scale parameter, as an estimumate of the SD of the normal data. This does not work well, however, but instead overestimates the SD of the normal data as seen below:
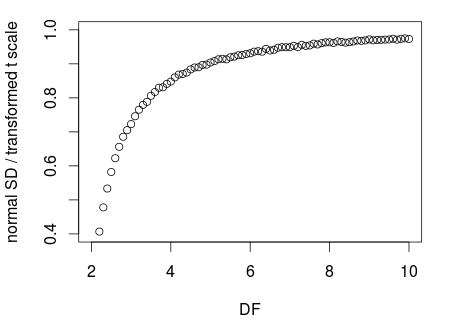
enter image description here

$\endgroup$
10
  • $\begingroup$ What is the point of fitting a t distribution to data governed by a Normal distribution? The t will be a bad fit, so one would expect the estimated scale will depend heavily on whatever method fitting method is used. It does not seem that this procedure would teach us anything about the data at all. $\endgroup$
    – whuber
    Commented Jan 16, 2014 at 17:35
  • $\begingroup$ The t distribution is often proposed as a robust alternative to the Normal when doing Bayesian modelling. Thus it might be the case that you apply it on data that really is close to Normally distributed (but with real there is no way to know). In that case it would be useful to transform the scale of the t back to a the same "scale" as the SD of the Normal. A bit the same thing that is done when presenting a [MAD estimate](en.wikipedia.org/wiki/Median_absolute_deviation#Relation_to_standard_deviation) $\endgroup$ Commented Jan 17, 2014 at 10:07
  • $\begingroup$ Thank you: it's interesting to see where your question fits in. I still do not understand, though, the point of using a t distribution to model data that are actually generated by a Normal distribution. Your simulation just does not look relevant to that Bayesian application. $\endgroup$
    – whuber
    Commented Jan 17, 2014 at 15:25
  • $\begingroup$ Well in the case with data from an unknown source you don't know whether it is normal or not :) The scenario I'm thinking of is this: In the previous literature of subject X researchers have tended to report the estimated SD of datasets assuming normallity. Now I want to use assume the t-distribution due to it being more robust against outliers (I might suspect my data is contaminated or I might just be sloppy). If I go ahead with this and report the estimated scale of the t-distribution it will be difficult to compare with earlier research hence it could be useful to "scale" the scale... $\endgroup$ Commented Feb 7, 2014 at 11:18
  • $\begingroup$ I believe that if you use the SD of the t-distribution to report its scale (assuming DF exceeds 2) then that should be directly comparable to the SD of the normal distribution. Alternatively, you can convert previously reported SDs to inter-quantile ranges (such as the IQR) assuming normality and use that for your comparison. $\endgroup$
    – whuber
    Commented Feb 7, 2014 at 15:07

1 Answer 1

0
$\begingroup$

This question has now been answered by Tom Minka as an answer to one of my other questions: What would a robust Bayesian model for estimating the scale of a roughly normal distribution be?.

I believe this question should still not be deleted, it's still a different question even though the answer is the same :)

$\endgroup$

Your Answer

By clicking “Post Your Answer”, you agree to our terms of service and acknowledge you have read our privacy policy.

Not the answer you're looking for? Browse other questions tagged or ask your own question.