3
$\begingroup$

I am a beginner who needs some help reading some results from linear regressions.

I am looking for factors that influence the location of civil conflict events. My dependent variable is the distance from the capital (km), a continuous variable.

I have 4 control variables which are all continuous too.

The variable (fightcap) I want to test is the fight capability of the rebels. This ordinal variable has three levels:
1 = low
2 = moderate
3 = high

However, I read in a couple of textbooks that to deal with ordinal predictors it is better to convert them to dummy variables. I thus created two dummies:
fightCap(low): 1 if fightcap = 1, 0 otherwise
fightCap(moderate): 1 if fightCap = 2, 0 otherwise

Using JMP (the software I know best), I ran the two models in parallel: one (left) with the fightcap ordinal variable, the second (right) with both fightCap(Low) and fightcap(moderate) dummy variables.
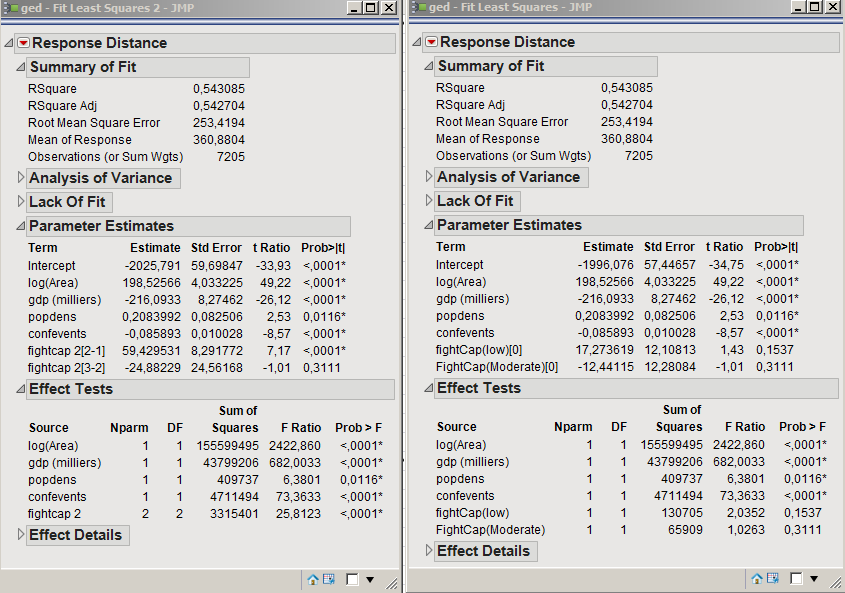
enter image description here

I notice that the output is identical for both models, excepts regarding the estimates of the ordinal/dummy variables.

My questions are thus the following:

  1. How do I interpret the terms "fightcap[2-1]", "fightcap[3-2]" and their estimates? Do I read that a change of "fightcap" from 1 to 2 results in a 59.42 change in the dependent variable?

  2. How do I interpret the fact that "fightcap[2-1]" has a significant estimate, but not "fightcap[3-2]"? Does it mean that only the variation from 1 to 2 explains the variation, but not the variation from 2 to 3?

  3. How can I understand that "half" of my variable works if using the ordinal setup, but none of the dummies has a significant estimate?

Thanks for your help!

Damien

$\endgroup$
3
  • $\begingroup$ worth noting (1) that on the right pane you have (low)(moderate) dummy variable and not (low)(high) dummy variables. (2) My understanding is that JMP uses fairly odd coding strategy for dummy variables. Looks like it has done "reverse helmert" coding? $\endgroup$
    – charles
    Commented Feb 12, 2014 at 15:02
  • $\begingroup$ My bad, I mixed the variable names. Now it's fixed. $\endgroup$
    – Damien
    Commented Feb 12, 2014 at 15:05
  • $\begingroup$ Possibly helpful notes from the JMP docs: Coding Nominal Effects and Ordinal Factors $\endgroup$
    – xan
    Commented Feb 12, 2014 at 16:23

1 Answer 1

2
$\begingroup$

(0) Both setups are essentially different forms of dummy variable setups. I think JMP is using reverse Helmert (?) coding here. While the dummies you created are traditional dummy coding (see: http://www.ats.ucla.edu/stat/r/library/contrast_coding.htm) Both these setups are treating the variables as Categorical and not Ordinal.

(1) Hard to say. I think so, if you have done reverse Helmert coding.

(2+3) Although sometimes people do look at the individual significant of dummies, for categorical variables you usually only test the joint significance of all the dummies created (+/- using partial F). If you defer to JMP it does this for you in the Effect Test section below your main output. If you create the dummies you have to go the the "custom test" section (I avoid JMP so memory might be off) and create a partial F test that all the coefficients for your dummies are equal to 0.

$\endgroup$
4
  • $\begingroup$ Thanks for the explanations! This is very useful. I looked at the "Effect Tests" panel as you suggested and found that the F ratio for the Ordinal variable FightCap is significant. What can I infer from this? Isn't the F ratio contradicting the estimates of the individual modalities? Do I conclude that my variable is not significant, significant, or partially significant? (here is a picture of the result: i.imgur.com/FBQyMZ2.png). $\endgroup$
    – Damien
    Commented Feb 13, 2014 at 9:16
  • $\begingroup$ I always just look at the partial F test for the variable as a whole, never the individual level p-values. If it is significant -as it is here - the variable is significant (adds information to the model). For traditional dummy coding the individual level p-values tells you if that level deviates significantly from reference level, but nothing about the variable as a whole. (that being said I would be surprised if you included all three possible comparisons and they were all p>0.05, but variable as whole was <0.05, but they are testing different things) $\endgroup$
    – charles
    Commented Feb 13, 2014 at 18:44
  • $\begingroup$ Thanks again for the precisions. My final question is about reading the coefficients. On this picture (i.imgur.com/df9W3Rr.png), I understand that for the two coefficients, the [2-1] compares a variation from 1 to 2, and the [3-2] a variation from 2 to 3, while the estimates given in Prediction expression panel both refer to the first (1) category as a baseline. My question is the following: if the variation from 2 to 3 is not significant in the first panel, does it imply that the coefficient for 3 compared to 1 given in the prediction expression is not significant as well? Thanks! $\endgroup$
    – Damien
    Commented Feb 14, 2014 at 11:22
  • $\begingroup$ (1) I don't use JMP so this guess (2) the model shown looks like it is for standard dummy coding and the coefficient estimates shown above for the 'reverse helmert' coding (3) Regarding question: No. if the difference between dummy coefficients (2) and (3) are not significant this had nothing to do with a comparison of (3) and (1). $\endgroup$
    – charles
    Commented Feb 14, 2014 at 18:02

Your Answer

By clicking “Post Your Answer”, you agree to our terms of service and acknowledge you have read our privacy policy.

Not the answer you're looking for? Browse other questions tagged or ask your own question.