1
$\begingroup$

Sorry to ask such a blunt question, but I'm running out of time and I just can't figure this seemingly simple thing out. It's the p-value for $B_0$, a single variable regression. $H_0: B_0=0$ and $H_1: B0 \neq 0$. $T_{calc} = (0.5681 - 0)/0.9284 = 0.6119$. Then it says $p\text{-value}=2 \cdot (t\ge 0,6119) =2 \cdot 0.281525$. Where is this $0.281525$ coming from? I know it has something to do with the table. $n=8$.

Sorry again, I have a test coming up, for some reason I can't figure this out. I spent way too much time on this now, watching youtube videos for the past 1.5 hours trying to figure out where this .2815... came from.

$\endgroup$
3
  • $\begingroup$ The exact format of t-tables varies a bit from one table to another. Can you print what the n = 8 row looks like? These days, these things are usually figured out by computer, without tables. $\endgroup$
    – Peter Flom
    Commented Jun 9, 2014 at 10:52
  • $\begingroup$ 1.44 1.94 2.45 3.14 3.71 sorry no that was for 6, because I was assuming n-k-1 degrees of freedom. for 8 it is: 1.4 1.86 2.31 2.9 3.36 $\endgroup$ Commented Jun 9, 2014 at 10:59
  • $\begingroup$ If that is it, then they didn't use that table. $\endgroup$
    – Peter Flom
    Commented Jun 9, 2014 at 11:20

1 Answer 1

5
$\begingroup$

A p-value is the probability of a statistic at least as extreme as the one observed if the null hypothesis is true.

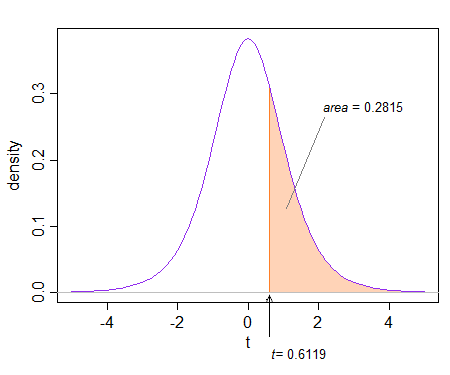
The value 0.281525 is the area to the right of 0.6119 on a t-density with 6 degrees of freedom.

enter image description here

That area represents a probability of being at least as large as the observed t-statistic. We then double it, because a value at -0.6119 is equally as extreme (in the other direction), which we must account for in a two-tailed test.

$\endgroup$
2
  • $\begingroup$ So if I have nothing but the t-table on paper, how do I know which p-value to use? $\endgroup$ Commented Jun 9, 2014 at 11:15
  • $\begingroup$ That depends on how your tables are organized, but the typical one-page tables probably don't show upper tail areas bigger than about 0.25. So, for example see the 6df row of this table. The smallest value there is 0.718, which has an area of 0.25 to the right of it. Your t-value is smaller, so the upper tail area is bigger than 0.25, and so the p-value is more than $2\times 0.25$; you'd write $p>0.5$ in that case. $\endgroup$
    – Glen_b
    Commented Jun 9, 2014 at 11:23

Your Answer

By clicking “Post Your Answer”, you agree to our terms of service and acknowledge you have read our privacy policy.

Not the answer you're looking for? Browse other questions tagged or ask your own question.