Yes, you can use R and lme4 for fitting discrete-time multilevel hazard models. According to Hox (2010, p. 163) "[t]he discrete or grouped survival model extends readily to multilevel models [...]". The analysis, though, have to be based on person-period data.
You also might want to check out the following references:
- Hox, J. (2010). Multilevel Analysis: Techniques and Applications (2 edition.). New York: Routledge.
- Snijders, T. A. B., & Bosker, R. J. (2012). Multilevel analysis. An introduction to basic and advanced multilevel modeling. London; Thousand Oaks, California: Sage. [esp. chapter 17]
- Steele, F. (2011). Multilevel Discrete-Time Event History Models with Applications to the Analysis of Recurrent Employment Transitions. Australian & New Zealand Journal of Statistics, 53(1), 1–20.
Example from Hox (2010: 168):
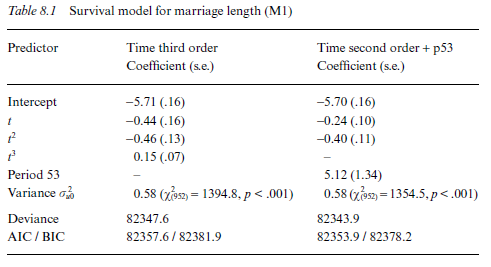
Here is an example that is about modelling divorce risks (data can be found here). Please find below the table from Hox' book:

And here is the corresponding R code and the results based on lme4. The results are not identical but I do not have the time to play with the model and the options for the estimators. It should be clear, though, that the results are close enough (except the variance of the random effects, that difference is pretty large)...
library(foreign)
library(lme4)
dat <- read.spss("D:/tmp/DataExchange/DataExchange/8 Survival/SibDivPP.sav",
                 to.data.frame = TRUE)

summary(glmer(divorce ~ t + t2 + t3 + (1 | famid), family = binomial, nAGQ = 1,
              data = dat))
Here are the results from R:
> summary(glmer(divorce ~ t + t2 + t3 + (1|famid),
+               family = binomial, nAGQ=1, data = dat))
Generalized linear mixed model fit by maximum likelihood (Laplace
  Approximation) [glmerMod]
 Family: binomial  ( logit )

[... output omitted ...]

Random effects:
 Groups Name        Variance Std.Dev.
 famid  (Intercept) 1.709    1.307
Number of obs: 43141, groups:  famid, 953

Fixed effects:
            Estimate Std. Error z value Pr(>|z|)
(Intercept) -5.47827    0.14413  -38.01  < 2e-16 ***
t           -0.50515    0.14804   -3.41 0.000644 ***
t2          -0.43206    0.11677   -3.70 0.000215 ***
t3           0.14260    0.05972    2.39 0.016951 *
---
Signif. codes:  0 ‘***’ 0.001 ‘**’ 0.01 ‘*’ 0.05 ‘.’ 0.1 ‘ ’ 1

