4
$\begingroup$

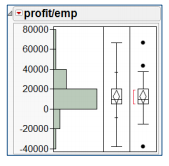
Here is a histogram (realized with JMP) displaying two types of box plot called outlier box plot and quantile box plot.

enter image description here

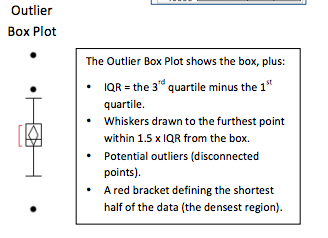
Right below, there are a bunch of explanations of the meaning of the different features of the outlier box plot.

enter image description here

The red bracket is "the shortest half of the data (the densest region)". What does this expression exactly mean? How different is it from the quartiles?

Source

$\endgroup$
4
  • $\begingroup$ This is the so-called "Shorth" of the data. For perfectly symmetric distributions, it corresponds to the box of the boxplot. $\endgroup$
    – Michael M
    Commented Sep 11, 2014 at 8:14
  • $\begingroup$ See also stats.stackexchange.com/questions/76848/… $\endgroup$
    – Nick Cox
    Commented Sep 16, 2014 at 18:00
  • $\begingroup$ @MichaelMayer That's true for perfectly symmetric unimodal distributions and some others. A U-shaped symmetric distribution would have either half of the distribution tying for shortest half, but the central box would be longer. $\endgroup$
    – Nick Cox
    Commented Sep 16, 2014 at 18:03
  • $\begingroup$ @NickCox: You are right! Still, the statistic in the OP is called "shorth" in the literature ;). $\endgroup$
    – Michael M
    Commented Sep 16, 2014 at 18:51

3 Answers 3

3
$\begingroup$

Think of all the ways that you could split the data into 2 "halves", You could start with the minimum to the median, then go from the 2nd lowest point to the point just above the median, then 3rd lowest point to ... then from the median to the highest point. Measure the length of all the "halves" that you computed and the red bracket shows the one that has the smallest range.

$\endgroup$
4
  • $\begingroup$ Do those halves need to be contiguous? I think the answer is yes, but want to be sure. $\endgroup$
    – Alexis
    Commented Dec 6, 2014 at 16:32
  • 2
    $\begingroup$ @Alexis If contiguity were not required, you could generate examples by forming balls of radius $\epsilon$ around each of the data values and taking the union of half of them. The limit of the total length as $\epsilon\to 0$ is zero, no matter how you choose the subsets, so nothing is accomplished. For continuous distributions, though, with density function $f,$ there will be some maximal threshold $t$ for which the total probability of the set $x:f(x)\gt t$ is $1/2$ or greater. This set has minimal length among all sets of probability $1/2$ or greater--and can be very disconnected. $\endgroup$
    – whuber
    Commented Dec 29, 2021 at 20:35
  • $\begingroup$ @whuber Ah, thank you. Regarding the possibly "very disconnected" set, is there an intuitive graphical representation of this? My mind wants to jump to a set of range(s) demarcating the most massive ranges of probability density… something like that? $\endgroup$
    – Alexis
    Commented Dec 29, 2021 at 21:03
  • 2
    $\begingroup$ @Alexis Imagine a distribution with many modes. One way to get one begins with a dataset: convolve that with a narrow-bandwidth kernel. The result is s a lot of narrow peaks located near the data values. The shortest-length region is a union of small intervals around each data point--and we have come full circle back to my original example! Some distributions have infinitely many modes. Take the density proportional to $2+\sin(1/|x|)$ for $-\pi\lt x\lt \pi,$ for instance. Its shortest-length half has infinitely many connected components. $\endgroup$
    – whuber
    Commented Dec 29, 2021 at 21:17
3
$\begingroup$

The red bracket represents the smallest interval that encompass 50% of the data.

The two quartiles represents the first 25% of the data from each side of the mean encompassing for 50% of the data but this is not necessarily the densest region.

Imagine a skewed distribution that has a very long tail on the right. The median might be much higher than the mode and be fairly high. In consequence the 25% quartile will eventually include the mode but the right quartile will be long in a very sparse space. The densest region necessarily include the median (exception in @whuber's comment below) and one of the two quartile.

$\endgroup$
1
  • 4
    $\begingroup$ (+1) One of your remarks is somewhat misleading, because the densest 50% region necessarily includes a median. The only way "the" median could not be included is when there are an even number of data values and either the upper or lower half is the densest 50%. But this occurs only because "the" median is conventionally defined as midway between the two middle values. So perhaps a more accurate and useful conclusion would be that a densest 50% region of a dataset always includes a median of the data. $\endgroup$
    – whuber
    Commented Sep 10, 2014 at 16:19
2
$\begingroup$

The JMP documentation is a little unclear--it just cites a book: Robust Regression and Outlier Detection.

However, it looks like the bracket contains the "highest density interval", or "highest probability density" interval. This is the smallest (i.e., shortest) interval that contains 50% of the data points.

Suppose your data looks like this

-30, -20, -10, 1, 2, 3, 4, 5, 6, 10, 20, 30.

The 50% densest region runs from 1 to 6 because it contains half the data (six of the twelve points) and is the shortest interval that does so: it's five units long, while the next closest interval (2 to 10) is eight units long instead.

The highest probability interval often shows up in Bayesian settings, sometimes as an alternative to confidence intervals. Here, they probably mean for you to use it a heuristic for detecting outliers.
$\endgroup$

Your Answer

By clicking “Post Your Answer”, you agree to our terms of service and acknowledge you have read our privacy policy.

Not the answer you're looking for? Browse other questions tagged or ask your own question.