5
$\begingroup$

I have the following dataset (triplicate values of 5 independent measurements and duplicate values of a control):

Sample 1    Sample 2  Sample 3    Sample 4    Sample 5    C
181.8       58.2       288.9       273.2       290.9      53.9
120.3       116.8      108.9       281.3       446        39.6
86.1        148.5      52.9        126         150.3

The six conditions are independent production of a chemical in six different microorganisms.

My aim was to find if the production of the chemical is significantly higher in Samples 1 - 5 than in C (control).

At first, I carried out mean, SD and t-test (one-tail). Although SD error bars are large, two of the samples have mean values that are significantly higher than that of C.

I decided to carry out median and Wilcoxon-Mann-Whitney test because of my worry about the size of my data and the high variations in the replicates. I was surprised however, that median and Wilcoxon-Mann- Whitney tests did not reveal statistical significant results.

I will be happy if anyone could advise me on the best way to analyse this small dataset.

$\endgroup$
1
  • $\begingroup$ could you pls describe the design of your study in detail, for example: where the micro-organisms same across samples, are the samples representative of some treatment or just replicates, etc? $\endgroup$
    – suncoolsu
    Commented Jun 12, 2011 at 14:02

3 Answers 3

7
$\begingroup$

One could use a non-parametric version of ANOVA: this is called the Kruskal-Wallis test. It is based on ranking all 17 results and computing the mean ranks within each group. The mean rank of 2.0 among the controls is obviously smaller than any other mean rank (which range from 7 to 12). However, the test p-value is only 0.0937 (based on a chi-squared approximation).

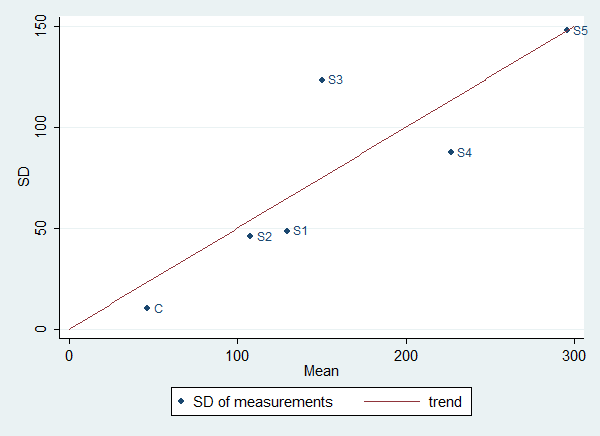
Within each group (including the control), the SDs are approximately one-half the means (the "trend" in the figure).

scatterplot of SDs versus means by group

This suggests (and justifies) basing the analysis on the logarithms of the concentrations, for which the group SDs will be approximately stable. This provides 11 degrees of freedom for estimating variation, so having just two or three measurements per group is not a limitation. This observation (that using logarithms may stabilize the residuals) is important in its own right, because it indicates how best to make estimates, how to carry out future analyses on continuations of this experiment, and supports the perception that the standard deviation of the control measurements really is relatively small. (That otherwise is a weak conclusion because there are only two control measurements.)

Regression (or equivalently, ANOVA) of the logs against the group identifiers has an overall p-value of 0.0521 (using an F-test with 5 and 11 degrees of freedom). This is suggestive but not quite low enough to be taken as "significant" by most journals. However, this is a two-sided test, whereas your hypothesis is one-sided. A crude adjustment is to halve the p-value to reflect this and report the result as "significant" with p approximately equal to 0.026.

Because this crude adjustment is merely an approximation, you might drive the point home with a permutation test. Returning to the idea of a non-parametric analysis, we ask for the chance that the average rank of the control measurement is 2.0 or less under the null hypothesis that all 17 results were randomly associated with the 17 measurements. This is equivalent to the control having either the first and second or the first and third smallest concentrations out of the 17. The chance of the first event is $\binom{2}{2}/\binom{17}{2} = 1/136$ and the chance of the second event is the same, for a total chance of $2/136$, or 1.47%. You could even conservatively characterize the results as "all the control concentrations were among the lowest three." The chance of this is $\binom{3}{2} / \binom{17}{2}$, equal to 2.2%. In any case you have a significant result for $p \lt 0.022$.

$\endgroup$
4
$\begingroup$

There is a time to make formal statistical inferences from sample to population, and a time to simply report on your descriptive results and let your audience make informal inferences--or not, as they see fit. This looks like the latter. With two control values, you are one step away from having no variation on which to base any findings.

"I was surprised however, that median and Wilcoxon-Mann- Whitney tests did not reveal statistical significant results." I recommend that you familiarize yourself with the literature on statistical power.

$\endgroup$
1
  • 1
    $\begingroup$ Thanks suncoolsu and Rolando2 for your replies. The micro-organisms are different mutants of the same spp. The data samples are technical triplicates for each mutant at a log phase of growth, monitored for the prodcution of a specific chemical. Unfortunately, the 3rd replicate for control was lost during experiment. $\endgroup$
    – Rob
    Commented Jun 12, 2011 at 18:08
2
$\begingroup$

This is an interesting data set. It seems like a good idea to follow @whuber's advice and do the analysis on the log scale. However, there is more than one hypothesis here. For you could have the hypothesis

$$H_{0}:\text{samples 1-5 have the same mean and variance on the log scale,}$$ $$\text{and this is different from the control mean}$$

But you could also have:

$$H_{1}:\text{samples 1-3 have the same mean and variance on the log scale,}$$ $$\text{and this is different from the control mean, and samples 4-5 have}$$ $$\text{the same mean and variance but different from both control group}$$ $$\text{and samples 1-3}$$

$H_{1}$ appears to be the most plausible hypothesis to me as judged by eye. You can also have:

$$H_{2}:\text{samples 1-5 have different means and variances on the log}$$ $$\text{scale, and are different from the control group}$$

Each of these hypothesis, if true, would constitute some sort of "significant" result. In any case, once you have decided that they are different, the interest then shifts to saying "well, exactly how are they different?"

I think you have a less significant result because you are testing $H_{2}$ which has many parameters.

For $H_0$ we have $\text{mean}\pm\text{standard dev}$ of $5.0\pm 0.62$ and $3.8\pm 0.22$, showing a clear difference, the behrens fisher statistic is $$T=\frac{5.0-3.8}{\sqrt{\frac{0.62^2}{15}+\frac{0.22^2}{2}}}=5.39$$

The two-sample T statistic is about $2.64$, but the assumption of equal variance is not supported by the data, especially as the control group was by far the lowest variance, and is nearly triple the variance of the pooled sample.

More later as I have to stop for now...

$\endgroup$
6
  • $\begingroup$ Simultaneously constructing and testing hypotheses is a matter for exploration, which is fine (and a good idea no matter what). However, any p-values computed during such exploration do not have their usual interpretation. They tend to make results look more "significant" than they really are. Therefore $H_1$ is irrelevant to the original question. What is of import is how precisely to interpret the stated hypothesis, "production of the chemical is significantly higher in Samples 1 - 5 than in C." Does this mean in all samples or just in some? Usually it's the latter. $\endgroup$
    – whuber
    Commented Jun 13, 2011 at 14:42
  • $\begingroup$ @whuber - at what point do I suggest computing p-values or significance tests? I will finish my answer at a later stage, but I was going to adopt a multiple hypothesis testing approach using Bayesian methods, similar to that given here. In order to do the appropriate hypothesis test, you need to specify which alternatives you are testing the null against. $\endgroup$ Commented Jun 13, 2011 at 22:30
  • $\begingroup$ (cont'd) - Even if it is just "some" samples are different, this is still contained in the hypothesis I have given. If any of them are true (in addition to a number of other hypothesis), then we can say "some" samples are different. And I personally would be not satisfied with simply saying that some samples are different; once you learn that they are different, surely you should then test which ones are different. $\endgroup$ Commented Jun 13, 2011 at 22:35
  • $\begingroup$ @whuber and probabilityislogic - thanks so much for your contributions. I will have some questions later as I'm still digesting some of the information already contributed. $\endgroup$
    – Rob
    Commented Jun 14, 2011 at 7:01
  • $\begingroup$ I have two questions:Will I be correct to suggest that calculating the regression degrees of freedom to be 11 degrees of freedowm was based on 17 observations minus (5 + 1) parameters? Please explain the use of 5 and 11 degrees of freedom here: "Using an F-test with 5 and 11 degrees of freedom". $\endgroup$
    – Rob
    Commented Jun 14, 2011 at 22:33

Your Answer

By clicking “Post Your Answer”, you agree to our terms of service and acknowledge you have read our privacy policy.

Not the answer you're looking for? Browse other questions tagged or ask your own question.