1
$\begingroup$

how can I add a label to the max value of this plot:

qplot(c, data=subset(df,c < 3000),geom="freqpoly")
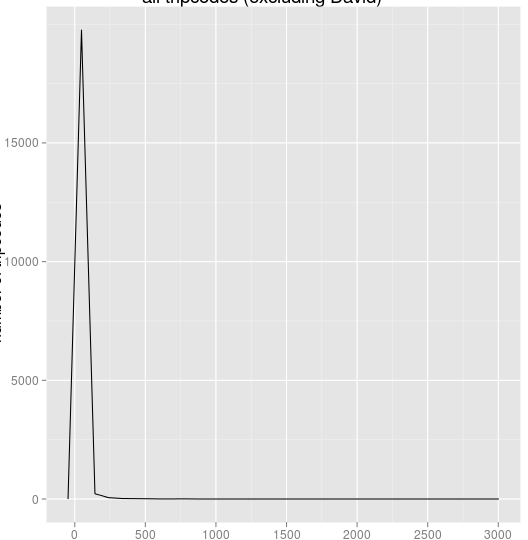
enter image description here

c is just integers

$\endgroup$

1 Answer 1

3
$\begingroup$

I think either annotate or geom_text is what you're looking for. https://stackoverflow.com/questions/2409357/how-to-nicely-annotate-a-ggplot2-manual

$\endgroup$

Your Answer

By clicking “Post Your Answer”, you agree to our terms of service and acknowledge you have read our privacy policy.

Not the answer you're looking for? Browse other questions tagged or ask your own question.