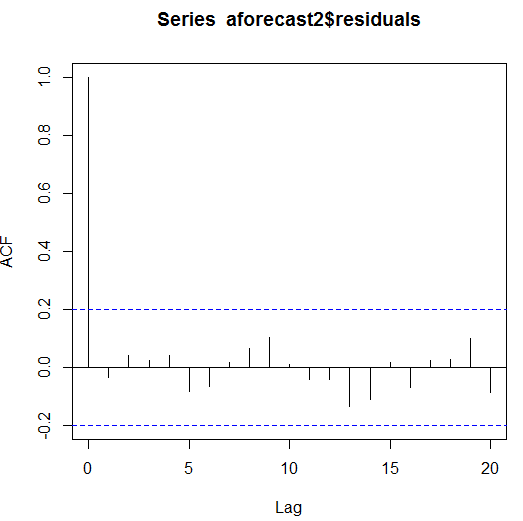
I obtained an ACF plot from R. Please see below:

Does that mean the observations are independent? What do small autocorrelations imply?
I obtained an ACF plot from R. Please see below:

Does that mean the observations are independent? What do small autocorrelations imply?
Does that mean the observations are independent?
No. The autocorrelations are consistent with independence, but they're also consistent with very small autocorrelation, and also consistent with forms of dependence that don't show up as autocorrelation.
What do small autocorrelations imply?
Well, if the only possible form of dependence is autocorrelation and $n$ is large, they imply that the dependence will be small. In your case, the $n$ looks to be around 100, so the population autocorrelations may not all be especially small (some could well be as large as about .35 or so in absolute value). It's not likely any have very large magnitude.
Auto-Correlation is a property of time-series data which indicates a pattern i.e. can a past value be a useful indicator of a future value. It shows repeating patterns which are otherwise hidden in noisy data. At lag 0 , you see that ACF is 1 which is basically the correlation of your data with itself. The dotted lines are levels above which the ACF is said to be significant. In your case, there is no significant ACF. If there is significant ACF, then an ARIMA model can be used to model the time series.
Yes, the observations are independent. Small auto-correlations imply there is not enough evidence to support the theory that a past value could given an indication of the magnitude of a future value.
Additionally, you can use CCF to check the lagged correlation between two time-series variables.
This questions might be very helpful to you - What's the deal with autocorrelation?