4
$\begingroup$

I don't have a strong background in statistics, so forgive me if I'm making very elementary mistakes here or if this question is too simplistic.

I am in a club with ~80 members, and every week, 10 members are selected to win a prize.

No member can be selected to win a prize twice in a row, but other than that, anything goes. Some members are selected more often than others, though. For example, a few people are consistently selected as a winner pretty much every second or third week, while several others get picked only a few times a year. There's also a bunch of new members, so there's not enough data to know how often they will get picked (though they automatically get picked the week that they join).

I would like to make a program that would give a rough prediction of the chance that each member gets picked in the next week, and in the next month, based on previous data (I have records from every week for the past year).

Right now, my idea is to look at the gaps in between weeks that each member gets picked (e.g. "Annie"'s gaps are 3 3 3 3 3 2 4 3 4 3 5 7 4, so she usually gets picked at least once a month), and assume that this is a normal distribution. Then I look at how long has it been since she was last picked, to see what would be the next gap would be if she gets picked next week, and then look at the standard bell curve to determine the % chance that the next gap would be that value or lower (one-sided z-score).

The problem that I see is that this doesn't take into account the "no member will get picked twice in a row" rule (which may be significant for those who get picked very very often), and I am not sure how well the standard normal curve works for discrete values like number of weeks (as opposed to something like height, which can be).

Is my idea good enough to get at least something reasonably useful, or are there just too many issues with it? If so, is there an alternate model that I can use? Again, I'm not looking for anything rigorous or overly complicated (like Hidden Markov models and such) that takes everything into account perfectly, just something remotely useful to get me a rough idea of the upcoming picks.

EDIT:
Yes, there is some sort of mechanism where certain members consistently get a better chance of winning, but we don't know the exact details. It can be approximated by the analogy of "some people having more raffle tickets than others, but nobody knows how many tickets each member has in the raffle". The only information we have on the "weight" given to each member's chances is the past record of winnings.

In actuality, there's a lot of different factors that influence who will win the raffle for that week, but almost none of those details are known for sure. I am assuming that these factors remain constant over time, though in actuality this is not always the case. For example, a member could get banned from winning anything for several weeks if they broke certain rules and such... But it'd be impossible to come up with anything usable if we need to take that into account.

$\endgroup$
4
  • $\begingroup$ You don't say explicitly that eligible members (that is, those that didn't win in the previous week) all have the same chance of winning the raffle. Is this the case, or is there a mechanism (like buying different numbers of raffle tickets) by which members differentiate their chances of winning? $\endgroup$
    – Erik P.
    Commented Jul 12, 2011 at 19:32
  • $\begingroup$ There is some sort of mechanism where certain members get a better chance of winning, but we don't know the exact details. You can think of it like some people have more raffle tickets than others, but nobody knows how many tickets each member has. $\endgroup$ Commented Jul 12, 2011 at 20:31
  • $\begingroup$ It might help if you give us some more details on the exact mechanism, since it may suggest an approach that could work. For example, what these different factors are and how they might interact. $\endgroup$
    – Erik P.
    Commented Jul 12, 2011 at 21:33
  • $\begingroup$ @I like The analysis in terms of tickets is similar to the analysis in terms of individual people having equal chances. It's a little more complicated because the chance of someone winning can vary from week to week. But since you don't know how many tickets each person has, there is very little you can do about predicting who will win in the future unless you make additional assumptions (such as each person consistently buys about the same number of tickets each week). $\endgroup$
    – whuber
    Commented Jul 12, 2011 at 21:51

2 Answers 2

5
$\begingroup$

Each week, there are 80-10 = 70 members eligible for a prize. Because 10 are chosen, the chance any one of them will receive a prize is 10/70 = 1/7. For the following week, that chance drops to 0. It then returns to 1/7 until the next time a prize is received.

If the raffle is fair and unbiased, previous records are irrelevant. This follows because we are assuming the eligible people are chosen for prizes according to an unbiased randomization mechanism whose actions one week are independent of its actions any other week.

To compute the chance that someone will receive at least one prize during a future period, compute the chance that they will receive no prize during the same period and subtract that from 1.

Suppose the period in question includes $k$ weeks. There are two cases: either they just won a prize and next week is part of the period, or else either (a) they just won a prize and next week is not part of the period or (b) they did not just win a prize. In the second case, the chance of not getting a prize each week is 1 - 1/7 = 6/7, so (the independence of the weekly draws implies) the chance of not getting a prize during this period equals $(6/7)^k$. If they have just won, the chance of not getting a prize in the following week equals 1, so the chance of not getting a prize during this period increases to $1 (6/7)^{k-1}$: that's the first case.

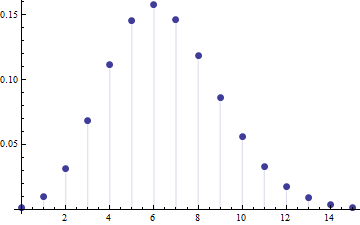
In the long run, everybody should win approximately 10/80 = 1/8 of the time. There will be statistical variation due to the randomization. It will be described to a good approximation by the Poisson distribution. This says that the chance of someone winning exactly $k$ times during a long period of $n$ weeks equals $\exp(-n/8) (n/8)^k / k!$.

This graphic plots those chances for the case $n=52$ weeks. The number of wins $k$ is shown on the horizontal axis and the chance of exactly $k$ wins is plotted on the vertical axes.

Discrete plot of Poisson pdf with intensity 52/8

You can see there are appreciable chances of someone winning 12 or more times during 52 weeks: the value is about 3.4%. With 80 people involved in your club, you should expect several of them to have won at least 12 times (because 3.4% of 80 is between 2 and 3). Similarly, several will have won only once or twice (4.2% chance). In fact, even though the chance that one given person will not win in an entire year is low (only 0.15%), it's not entirely unlikely that someone out of the eighty will fail to win in an entire year (this chance is around 11%).

For instance, here are the results of simulating this raffle for exactly 52 weeks with a constant 80 people (allowing all 80 to be eligible the first week):

$$\begin{array}{cc} \text{# prizes} & \text{count} \\ 0 & 1 \\ 2 & 1 \\ 3 & 6 \\ 4 & 7 \\ 5 & 16 \\ 6 & 11 \\ 7 & 12 \\ 8 & 9 \\ 9 & 8 \\ 10 & 7 \\ 12 & 1 \\ 16 & 1 \end{array} $$

Therefore, unless you have significant evidence that the drawing is biased or unfair, you can expect any ten of the eligible people to be selected next week, regardless of their past successes or failures in the raffle: that's your best "idea about the upcoming picks."

$\endgroup$
2
  • 1
    $\begingroup$ The raffle is not fair and unbiased. It will consistently pick certain members more frequently than others. See my comment that I added above. $\endgroup$ Commented Jul 12, 2011 at 20:29
  • 2
    $\begingroup$ Are you certain of this because you know something beyond the data (i.e. Annie is the guild leader's girlfriend), or do you suspect this because it seems like some people win too often? As whuber points out in his simulation, in a fair raffle, one person could win every 3 weeks for an entire year, 1 person once a month, and 7 people every five weeks or so, then one "unlucky" person never winning even though they were eligible 52 weeks in a row. That can seem unfair. Your example of Annie has her winning 14 times in roughly a year. $\endgroup$
    – Wayne
    Commented Jul 12, 2011 at 20:51
2
$\begingroup$

An easy approach would be to approximate the situation by a model where every eligible member $n$ (i.e., every member that didn't win in the previous week) has a fixed, unknown chance $p_n$ of winning. So in this approximation, the number of prizes per week would not be fixed. If this is the case, then you can reduce the gaps to drawings of a geometrically distributed random variable by subtracting 2 from each of them (or 1 depending on your definition of the geometric distribution). You can then estimate $p_n$; an obvious choice would be the maximum likelihood estimator, which would be

$${\hat p}_n = \left( \frac{1}{k_n}\sum_{i=1}^{k_n} (G_{n,i} - 2) \right)^{-1},$$

where $G_{n,i}$ is the $i$th gap between successive winnings of player $n$, for $1 \leq i \leq k_n$; $k_n$ is the number of gaps known for player $n$, which in turn is the number of times $n$ has won minus one. I think this estimator is biased; I'm not sure what an appropriate correction factor would be. But if you have more than a few observations per player, you should be fine.

However, from the data that you give, using the analysis of @whuber in the other answer, I would think that the effect of "luck" is substantially greater than the true differences in $p_n$s. This means that the quality of the information you get out of this or any other estimation method will be rather poor until you have many years of data for constant $p_n$ - if someone has a low $\hat p_n$, that means that the likelihood of having a low actual $p_n$ is only marginally larger than for members with a high $\hat p_n$.

Note also that if you get new members, then everybody's $p_n$ changes. It would probably be possible to take this into account by a scaling factor, but I don't immediately see how.

$\endgroup$
0

Your Answer

By clicking “Post Your Answer”, you agree to our terms of service and acknowledge you have read our privacy policy.

Not the answer you're looking for? Browse other questions tagged or ask your own question.