15
$\begingroup$

My background is mainly in machine learning and I was trying to learn what Bayesian Hypothesis testing meant. I am ok with the bayesian interpretation of probability and I am familiar with it in the context of probabilistic graphical models. However, what is confusing me is what the word "Hypothesis" means in the context of statistical inference.

I think I am mostly getting confused about the vocabulary that I am used to in machine learning vs what is normally used in statistics and inference.

In the context of supervised learning, I normally think of the hypothesis as the predictive function that maps examples to its labels i.e. $h:\mathcal{X} \rightarrow \mathcal{Y}$. However, it seems to me that the term hypothesis, in the readings that I am doing don't have the same meaning. Let me paste an extract of the readings I am reading:
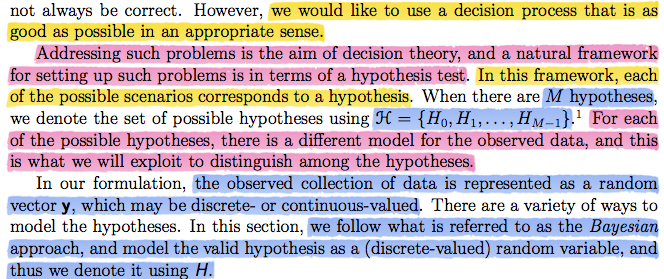
enter image description here

If you read carefully it also says:

there is a different model for the observed data ...

were they use the word model. For me the word model makes me think of a set of functions were we select a specific predictive function. i.e. a hypothesis class of function. For example, $\mathcal{H_{d2}}$ could be the hypothesis class of quadratic functions (polynomial of degree 2). However, it seems to me that they use the word model and hypothesis as synonymous in this extract (where for me they are completely different words).

Then it goes on to mention that we can put priors to hypothesis (a completely reasonable thing to do in a bayesian setting):

$$p_H(H_m), \ \ \ \ \ m=\{0, 1, ..., M-1 \}$$

also we can characterize the data with a current hypothesis:

$$p_{y|H}( \cdot |H_m), \ \ \ \ \ m=\{0, 1, ..., M-1 \}$$

and update our current believes given some data (and Baye's rule):

$$p_{H|y}(H_m|y), \ \ \ \ \ m=\{0, 1, ..., M-1 \}$$

However, I guess I am more used to putting a bayesian estimate to a particular parameter (say $\theta$) from a hypothesis class rather than to the whole hypothesis class. Basically since it seems that these "hypotheses" are not the same hypotheses from the machine learning context that I am used to, it seems to me that these hypotheses are more similar to a specific $\theta$ parameter than to a hypothesis class.

At this point I was convinced that "hypothesis" meant the same thing as in the predictive function (parametrized by a parameter $\theta$, for example), but I think I was wrong...

To make my confusion even worse, later these same reading went ahead to specify a particular "hypothesis" to each training example that they observed. Let me paste an extract of what I mean:
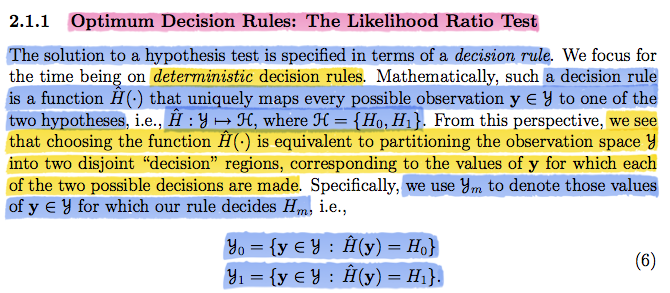
enter image description here

the reason that this confuses me is that, if I interpret hypothesis as a parameter, then for me it makes no sense to specify a specific parameter for each sample value that we see. At this point I concluded that I really didn't know what they meant by hypothesis so I posted this question.

However, I didn't fully give up, I researched what hypothesis means in frequentist statistics and found the following khan academy video. That video actually makes a lot of sense to me (maybe you are a frequentist! :). However, it seems that they get a bunch of data (like some "sample set") and based on the properties of the sample set, they decide whether to accept or reject the null hypothesis about the data. However, in the Bayesian context that I am reading, it seems to me that for each data [point] vector that is observed, they "label it" with a hypothesis with the "Likelihood ratio test":

enter image description here

The way they are assigning hypothesis to each data sample, even seems like a supervised learning setting were we are attaching a label to each training set. However, I don't think that's what they are doing in this context. What are they doing? What does it mean to assign a hypothesis to each data sample? What is the meaning of a hypothesis? What does the word model mean?

Basically, after this long explanation of my confusion, does someone know what bayesian hypothesis testing means in this context?


If you need any clarification or anything to improve my question or so that the question makes sense, I am more than happy to help :)


In my search for an answer I found some useful things related to statistical hypothesis testing:

This one addresses a good introduction to the topic if you come from a CS background (like me):

What is a good introduction to statistical hypothesis testing for computer scientists?

At some point I asked about "default parameters" (which I should have defined what I meant. I thought it was a standard term but it isn't, so here I will address it) and I think what I truly meant is how do you specify parameters for each hypothesis that you have. For example, how do you decide what your null hypothesis is and its parameters. There is a question related to that:

How to specify the null hypothesis in hypothesis testing

$\endgroup$
8
  • $\begingroup$ @Xi'an I read the following wikipedia article: en.wikipedia.org/wiki/Statistical_model is that what they mean by a model and a hypothesis? thnx for ur patience btw :) $\endgroup$ Commented Dec 23, 2014 at 18:33
  • 3
    $\begingroup$ I am hesitant to wade into this discussion because I think your problem is really that one of understanding what hypothesis testing means in principle, rather than specifically what hypothesis testing is in the Bayesian framework. To help with this, I suggest having a look at the book "Modes of Parametric Statistical Inference" by Geisser. books.google.ca/… $\endgroup$
    – rocinante
    Commented Dec 28, 2014 at 3:04
  • $\begingroup$ @rocinante I think I agree with you. I am definitively confused about hypothesis testing in general (and the bayesian framework doesn't help at all). I will definitively take a look at that. Thanks for your patience and understanding, its greatly appreciated. $\endgroup$ Commented Dec 28, 2014 at 4:01
  • $\begingroup$ It's not an easy thing to understand because it's not an easy thing to articulate in a concise way. Rather than think about this in abstract terms (like maps), maybe it will help if you think about it with a simpler example.1/2 $\endgroup$
    – rocinante
    Commented Dec 28, 2014 at 4:14
  • 1
    $\begingroup$ 2/2 Suppose you have a coin and you want to see if it is fair, so you flip it 50 times. You now have a data set about which you want to make some inference (i.e. is the coin biased or not). Logically, if the coin is fair, about half the tosses should be heads. (Note that this is not a stats derivation, but your own logical reasoning). That is your hypothesis. You can test this hypothesis 2 ways: the Bayesian way and the frequentist way. $\endgroup$
    – rocinante
    Commented Dec 28, 2014 at 4:17

3 Answers 3

10
$\begingroup$

A statistical model is given by a family of probability distributions. When the model is parametric, this family is indexed by an unknown parameter $\theta$: $$\mathcal{F}=\left\{ f(\cdot|\theta);\ \theta\in\Theta \right\}$$ If one wants to test an hypothesis on $\theta$ like $H_0:\,\theta\in\Theta_0$, one can consider two models are in opposition: $\mathcal{F}$ versus $$\mathcal{F}_0=\left\{ f(\cdot|\theta);\ \theta\in\Theta_0 \right\}$$ From my Bayesian perspective, I am drawing inference on the index of the model behind the data, $\mathcal{M}$. Hence I put a prior on this index, $\rho_0$ and $\rho_a$, as well as on the parameters of both models, $\pi_0(\theta)$ over $\Theta_0$ and $\pi_a(\theta)$ over $\Theta$. And I then deduce the posterior distribution of this index: $$\pi(m=0|x)=\dfrac{\rho_0\int_{\Theta_0} f(x|\theta)\pi_0(\theta)\text{d}\theta}{\rho_0\int_{\Theta_0} f(x|\theta)\pi_0(\theta)\text{d}\theta +(1-\rho_0)\int_{\Theta} f(x|\theta)\pi_a(\theta)\text{d}\theta}$$ The document you linked to goes into much more details into this perspective and should be your entry of choice into statistical testing of hypotheses, unless you can afford to go through a whole Bayesian book. Or even a machine learning book like Kevin Murphy's.

For instance, in the setting where $X\sim\mathcal{N}(\theta,1)$ is observed, if the hypothesis to be tested is $H_0:\theta=0$, the posterior probability that $\theta=0$ is the posterior probability that the model producing the data is $\mathcal{N}(0,1)$. According to the above formula, if the prior distribution on $\theta$ is $\theta\sim\mathcal{N}(0,10)$, and if we put equal weights on both hypotheses, i.e., $\rho_0=1/2$, this posterior probability is \begin{align*}\pi(m=0|x)&=\dfrac{\frac{1}{\sqrt{2\pi}}\exp\{-x^2/2\}}{\frac{1}{\sqrt{2\pi}}\exp\{-x^2/2\} +\int_{\mathbb{R}} \frac{1}{\sqrt{2\pi}}\exp\{-(x-\theta)^2/2\}\frac{1}{\sqrt{2\pi\times10}}\exp\{-\theta^2/20\}\text{d}\theta}\\ &=\dfrac{\exp\{-x^2/2\}}{\exp\{-x^2/2\} +\frac{1}{\sqrt{11}}\exp\{-x^2/22\}} \end{align*}

$\endgroup$
8
  • $\begingroup$ sorry if my question is a little repetitive, but I am still unsure what hypothesis means, at least in the context of the document I provided. When a probability $p_{H}(H_0)$ is assigned, does it mean that we have an uncertainty (in your notation from your answer) on $\mathcal{F}_0$ or on specific $\theta \in \mathcal{F}_0$? For example, when it says $p_{y|H}( y |H_0)$, does it mean what the likelihood of some specific data y given that the data describing it comes from the family of distributions as specified by $H_0$ or some specific parameter specified from $H_0$? $\endgroup$ Commented Dec 24, 2014 at 18:51
  • $\begingroup$ Or maybe a hypothesis $H_m$ indicates both (as a pair), a specific parametrization $\theta$ from a specific family $\mathcal{F}_{m}$. i.e. $H_m = (\theta, \mathcal{F}_m)$ where $\theta \in \mathcal{F}_m$. Btw, I appreciate your time and help immensely. Thnx :) $\endgroup$ Commented Dec 24, 2014 at 19:02
  • $\begingroup$ The pair you mention is the (model index,parameter value), both of which are endowed with prior probabilities. So $\varrho_0$ is the prior probability or belief that the model $H_0$ (or $\mathcal{F}_0$) is the right one (with the default choice $\varrho_0=0$) and $\pi_0(\theta)$ is the prior distribution on the parameter $\theta$ of the model under $H_0$. $\endgroup$
    – Xi'an
    Commented Dec 25, 2014 at 9:09
  • $\begingroup$ so if the a hypothesis is a tuple of a proposed statistical model and a default parameter, how is the default parameter chosen? $\endgroup$ Commented Dec 28, 2014 at 1:23
  • $\begingroup$ I do not understand what you mean by "default parameter": an hypothesis is either a model with all parameters fixed to known values (like $\theta=0$ in the above example) or with some parameters unknown. In the later case, a Bayesian approach implies putting prior distributions on those unknowns. $\endgroup$
    – Xi'an
    Commented Dec 28, 2014 at 9:50
3
+50
$\begingroup$

Excellent question. I think your confusion may result from some of the basic differences between the "frequentist" and "Bayesian" perspectives. I have a lot of experience with the former and am new to the later so attempting a few simple observations might help me too. I edited your question to make a few distinctions clear - at least, as I understand them. I hope you don't mind! If I got something wrong, you could re-edit your question or add a comment on this response.

1) At the risk of sounding somewhat too elementary: A model is any statement that attempts an explanation of reality like "If I had pancakes for breakfast, it must be Tuesday." As such, a model is an hypothesis. A famous quote by George Box: "All models are wrong, some models are useful." For a model to be useful there must be some way to test it. Enter the concept of competing hypotheses and the answer to one of your questions. I would suggest that "...in the context of statistical inference," an hypothesis is any model that may be useful and can be tested mathematically. So hypothesis testing is a means of making a decision about whether a model is useful of not. In summary, an hypothesis is a model under consideration. It could be different parameter values of the same function or different functions. I think your lecture notes are showing that different outcomes (measurements) in the sample space would make different hypotheses (Is the intercept parameter zero? Do I need a cube in that polynomial? Maybe it's really exponential?), more or less likely.

2) Your Kahn video is an example of what Bayesian's call the "Frequentist" approach to hypothesis testing so it may have confused you when trying to apply it to your lecture notes which are Bayesian. I have been trying to come up with a simple distinction between application of the two approaches (which may be dangerous). I think I understand the philosophical distinction reasonably well. From what I have seen, the "Frequentist" assumes a random component to the data and tests how likely the observed data are given non-random parameters. The "Bayesian" assumes the data are fixed and determines the most likely value of random parameters. This difference leads to different testing methods.

In "Frequentist" hypothesis testing, a model that may be useful is one which explains some effect so it is compared with the "null hypothesis" - the model of no effect. The attempt is made to set up a useful model that is mutually exclusive to the model of no effect. The test is then on the probability of observing the data under the assumption of no effect. If that probability is found to be low, the null hypothesis is rejected and the alternative is all that's left. (Note that a purist would never "accept" the null hypothesis, only "fail to reject" one. It may sound like angels dancing on the head of a pin but the distinction is a fundamental philosophical one) Intro statistics usually starts with what may be the simplest example: "Two groups are different." The null hypothesis that they are not different is tested by calculating how likely it would be to observe differences as great or greater as measured by a random experiment given that they are not different. This is usually a t-test where the null hypothesis is that the difference of the means is zero. So the parameter is the mean at a fixed value of zero.

The Bayesian says, "Hold on a minute, we made those measurements and they are different, so how likely is that?" They calculate the probability for every value of the (now) random parameter and pick the one that is highest as the most likely. So in a sense, every possible value of the parameter is a separate model. But now they need a way to make a decision about whether the model with the highest probability is different enough to matter. That's why your lecture notes introduced the cost function. To make a good decision, some assumption of the consequences of making the wrong decision is needed.

3) "What does it mean to assign a hypothesis to each data sample?" I don't think they are. Be careful with what is meant by "sample point." I believe they are referring to a particular sample vector and want to know how likely each hypothesis is for all sample vectors in the sample space. Equations (14) and (15) show how to compare two hypotheses for a particular sample vector. So they are simplifying a general argument of comparing multiple hypotheses by showing how to compare only two.

$\endgroup$
0
$\begingroup$

Say you have data from a set of boxes. The data consists of Length (L), Width (W), Height (H), and Volume (V).

If we don't know much about boxes/geometry we might try the model:

V = a*L + b*W + c*H + e

This model has three parameters (a, b, c) that could be varied, plus an error/cost term (e) describing how well the hypothesis fits the data. Each combination of parameter values would be considered a different hypothesis. The "default" parameter value chosen is usually zero, which in the above example would correspond to "no relationship" between V and L, W, H.

What people do is test this "default" hypothesis by checking if e is beyond some cutoff value, usually by calculating a p-value assuming a normal distribution of error around the model fit. If that hypothesis is rejected, then they find the combination of a, b, c parameters that maximizes the likelihood and present this is the most likely hypothesis. If they are bayesian they multiply the likelihood by the prior for each set of parameter values and choose the solution that maximizes the posterior probability.

Obviously this strategy is non-optimal in that the model assumes additivity, and will miss that the correct hypothesis is:

V = L*W*H + e

Edit: @Pinocchio

Perhaps someone disagreed with the claim that hypothesis testing is non-optimal when there is no rational reason to choose one/few functions (or as you put it: "hypothesis classes") out of the infinitely many possible . Of course this is trivially true, and "optimal" can be used in the limited sense of "best fit given the cost function and choices supplied". That comment made it into my answer because I disliked how the issue of model specification was glossed over in your class notes. It is the main problem facing most scientific workers, for which afaik there is no algorithm.

Further, I could not understand p-values, hypothesis testing, etc until I understood the history, so perhaps it will help you as well. There are multiple sources of confusion surrounding frequentist hypothesis testing (I am not so familiar with the history of the bayesian variant).

There is what was originally called "hypothesis testing" in the Neyman-Pearson sense, "significance testing" as developed by Ronald Fisher, and also an ill defined, never properly justified "hybrid" of these two strategies widely used throughout the sciences (which may be casually referred to using either above term, or "null hypothesis significance testing"). While I wouldn't recommend taking a wikipedia page as authoritative, many sources discussing these issues can be found here. Some main points:

  1. The use of a "default" hypothesis is not part of the original hypothesis testing procedure, rather the user is supposed to use prior knowledge to determine the models under consideration. I have never seen explicit recommendation by proponents of this model regarding what to do if we have no particular reason to choose a given set of hypotheses to compare. It is often said that this approach is suitable for quality control, when there are known tolerances to compare some measurement to.

  2. There is no alternative hypothesis under Fisher's "significance testing" paradigm, only a null hypothesis, which can be rejected if deemed unlikely given the data. From my reading, Fisher himself was equivocal on the use of default null hypotheses. I could never find him commenting explicitly on the matter, however he surely did not recommend that this should be the only null hypothesis.

  3. The use of the default null hypothesis is sometimes construed as an "abuse" of hypothesis testing, but it is central to the popular hybrid method mentioned. The argument goes that this practice is often "a useless preliminary":

    "The researcher formulates a theoretical prediction, generally the direction of an effect... When the data in fact show the predicted directional result, this seems to confirm the hypothesis. The researcher tests a 'straw person' null hypothesis that the effect is actually zero. If the latter cannot be rejected at the .05 level (or some variant), then the apparent confirmation of the theory cannot be claimed...A common error in this type of test is to confuse the significance level actually attained (for rejecting the straw-person null) with the confirmation level attained for the original theory... the strength of confirmation actually depends on [the sharpness of a researcher's numerical predictions], not on the significance level attained for a straw-person null."

    The null hypothesis testing controversy in psychology. David H Krantz. Journal of the American Statistical Association; Dec 1999; 94, 448; 1372-1381

The Khan academy video is an example of this hybrid method, and is guilty of committing the error noted in that quote. From the information available in that video we can only conclude that the injected rats differ from the non-injected, while the video claims we can conclude "the drug definitely has some effect". A bit of reflection would lead us to consider that perhaps the tested rats were older than the non-injected, etc. We need to rule out plausible alternative explanations before claiming evidence for our theory. The less specific the prediction of the theory, the more difficult it is to accomplish this.

Edit 2:

Perhaps taking the example from your notes of a medical diagnosis will help. Say a patient can be either "normal" or in "hypertensive crisis".

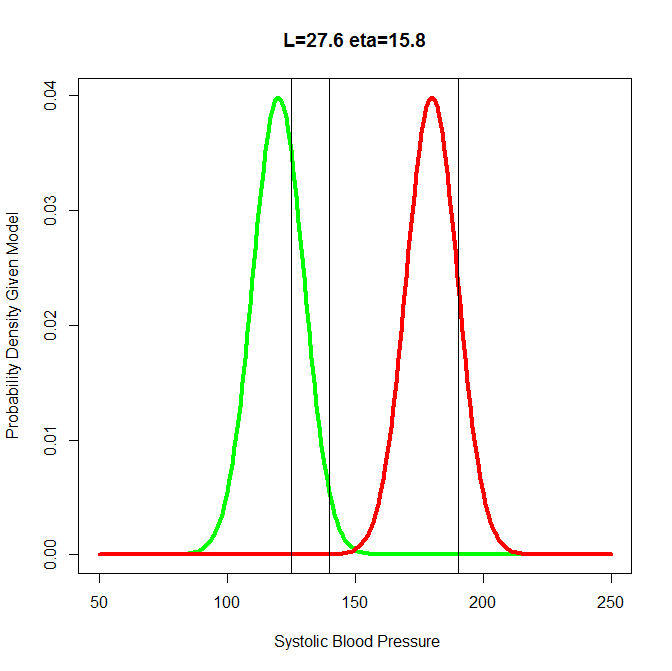
We have prior information that only 1% of people are in hypertensive crisis. People in hypertensive crisis have systolic blood pressure that follows a normal distribution with mean=180 and sd=10. Meanwhile, normal people have blood pressure from a normal distribution with mean=120, sd=10. The cost of judging a person normal when they are is zero, the cost of missing a diagnosis is 1, and the cost due to side effects due to the treatment is 0.2 regardless of whether they are in crisis or not. Then the following R code calculates the threshold (eta) and likelihood ratio. If the likelihood ratio is greater than the threshold we decide to treat, if less than we do not:

#Prior probabilities
P0=.99 #Prior probability patient is normal
P1=1-P0 #Prior probability patient is in crisis

#Hypotheses
H0<-dnorm(x=50:250, mean=120, sd=10) #H0: Patient is normal
H1<-dnorm(x=50:250, mean=180, sd=10) #H1: Patient in hypertensive crisis

#Costs
C00=0 #Decide normal when normal
C01=1 #Decide normal when in crisis
C10=.2 #Decide crisis when normal
C11=.2 #Decide crisis when in crisis

#Threshold
eta=P0*(C10-C00)/ P1*(C01-C11)

#Blood Pressure Measurements
y<-rnorm(3, 150, 20)

#Calculate Likelihood of Each Datapoint Given Each Hypothesis
L0vec=dnorm(x=y, mean=120, sd=10) #Vector of Likelihoods under H0
L1vec=dnorm(x=y, mean=180, sd=10) #Vector of Likelihoods under H1

#P(y|H) is the product of the likelihoods under each hypothesis
L0<-prod(L0vec)
L1<-prod(L1vec)

#L(y) is the ratio of the two likelihoods
LikRatio<-L1/L0


#Plot
plot(50:250, H0, type="l", col="Green", lwd=4, 
     xlab=" Systolic Blood Pressure", ylab="Probability Density Given Model",
     main=paste0("L=",signif(LikRatio,3)," eta=", signif(eta,3)))
lines(50:250, H1, col="Red", lwd=4)
abline(v=y)

#Decision
if(LikRatio>eta){
  print("L > eta  ---> Decision: Treat Patient")
}else{
  print("L < eta  ---> Do Not Treat Patient")
}

In the above scenario the threshold eta=15.84. If we take three blood pressure measurements and get 139.9237, 125.2278, 190.3765, then the likelihood ratio is 27.6 in favor of H1: Patient in hypertensive crisis. Since 27.6 is greater than than the threshold we would choose to treat. The graph shows the normal hypothesis in green and hypertensive in red. Vertical black lines indicate the values of the observations.

enter image description here

$\endgroup$
4
  • $\begingroup$ can the person that down voted this explain? Whats wrong with this answer? :S $\endgroup$ Commented Jan 4, 2015 at 3:54
  • $\begingroup$ @Pinocchio I have attempted to clarify things with some history in the answer, "hypothesis testing" is a difficult subject to discuss clearly due to that. I think I have answered the questions regarding how the terms model/ hypothesis are used but do not understand this one: 'What does it mean to assign a hypothesis to each data sample?' $\endgroup$
    – Livid
    Commented Jan 5, 2015 at 22:03
  • $\begingroup$ I can't understand why this answer was downvoted, and why it's not more upvoted. It is truly excellent. It could use a bit more of theoretical definitions, but it is clearly oriented towards a broader audience than statisticians. The first example using a GLM was particularly enlightening and totally in line with my (numerous) academic readings. The bottom line is that the main difference between frequentist and bayesian hypothesis testing is the accounting of the prior in order to compute the MAP (instead of only the MLE). $\endgroup$
    – gaborous
    Commented Sep 14, 2019 at 1:08
  • $\begingroup$ I might add that a graphical representation of the first example with the GLM would be awesome and very enlightening, maybe using a kind of leverage plot? $\endgroup$
    – gaborous
    Commented Sep 14, 2019 at 1:11

Your Answer

By clicking “Post Your Answer”, you agree to our terms of service and acknowledge you have read our privacy policy.

Not the answer you're looking for? Browse other questions tagged or ask your own question.