First, here are some quick comments:
- The $p$-values of a Kolmogorov-Smirnov-Test (KS-Test) with estimated parameters can be quite wrong because the p-value does not take the uncertainty of the estimation into account. So unfortunately, you can't just fit a distribution and then use the estimated parameters in a Kolmogorov-Smirnov-Test to test your sample. There is a normality test called Lilliefors test which is a modified version of the KS-Test that allows for estimated parameters.
- Your sample will never follow a specific distribution exactly. So even if your $p$-values from the KS-Test would be valid and $>0.05$, it would just mean that you can't rule out that your data follow this specific distribution. Another formulation would be that your sample is compatible with a certain distribution. But the answer to the question "Does my data follow the distribution xy exactly?" is always no.
- The goal here cannot be to determine with certainty what distribution your sample follows. The goal is what @whuber (in the comments) calls parsimonious approximate descriptions of the data. Having a specific parametric distribution can be useful as a model of the data (such as the model "earth is a sphere" can be useful).
But let's do some exploration. I will use the excellent fitdistrplus package which offers some nice functions for distribution fitting. We will use the functiondescdist to gain some ideas about possible candidate distributions.
library(fitdistrplus)
library(logspline)

x <- c(37.50,46.79,48.30,46.04,43.40,39.25,38.49,49.51,40.38,36.98,40.00,
38.49,37.74,47.92,44.53,44.91,44.91,40.00,41.51,47.92,36.98,43.40,
42.26,41.89,38.87,43.02,39.25,40.38,42.64,36.98,44.15,44.91,43.40,
49.81,38.87,40.00,52.45,53.13,47.92,52.45,44.91,29.54,27.13,35.60,
45.34,43.37,54.15,42.77,42.88,44.26,27.14,39.31,24.80,16.62,30.30,
36.39,28.60,28.53,35.84,31.10,34.55,52.65,48.81,43.42,52.49,38.00,
38.65,34.54,37.70,38.11,43.05,29.95,32.48,24.63,35.33,41.34)
Now let's use descdist:
descdist(x, discrete = FALSE)
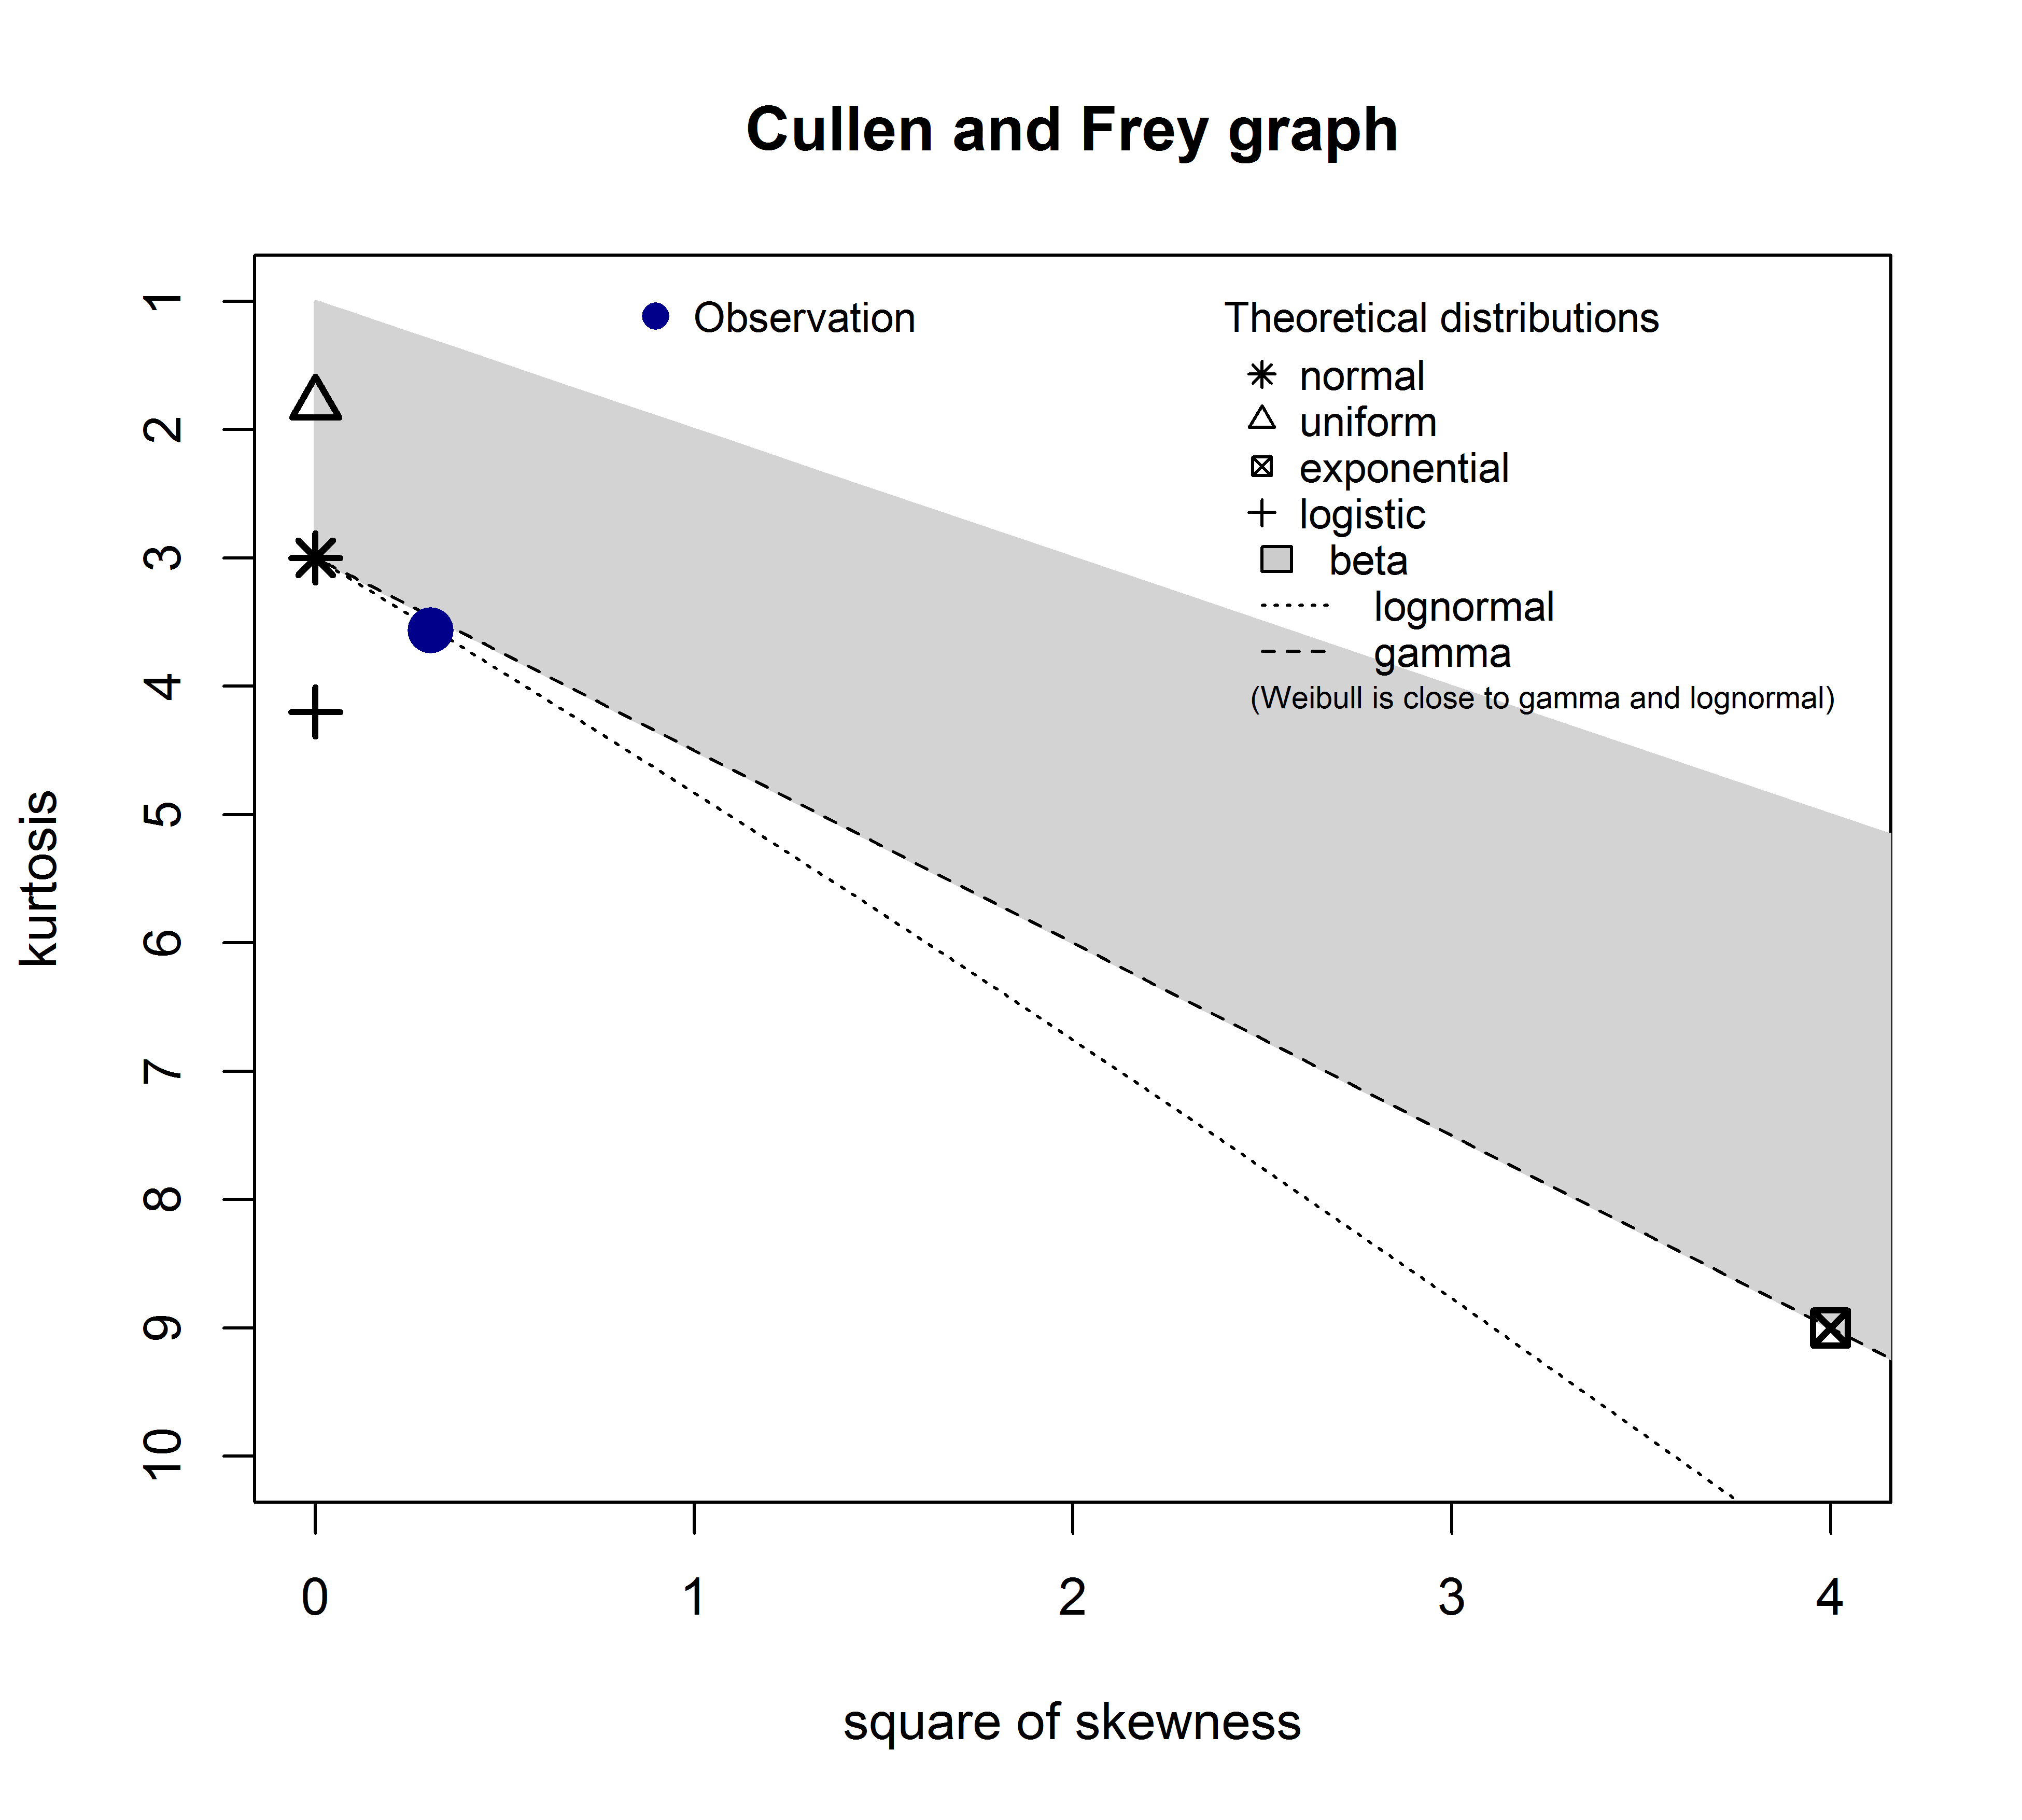
The kurtosis and squared skewness of your sample are plotted as a blue point named "Observation". It seems that possible distributions include the Weibull, Lognormal and possibly the Gamma distribution.
Let's fit a Weibull distribution and a normal distribution:
fit.weibull <- fitdist(x, "weibull")
fit.norm <- fitdist(x, "norm")
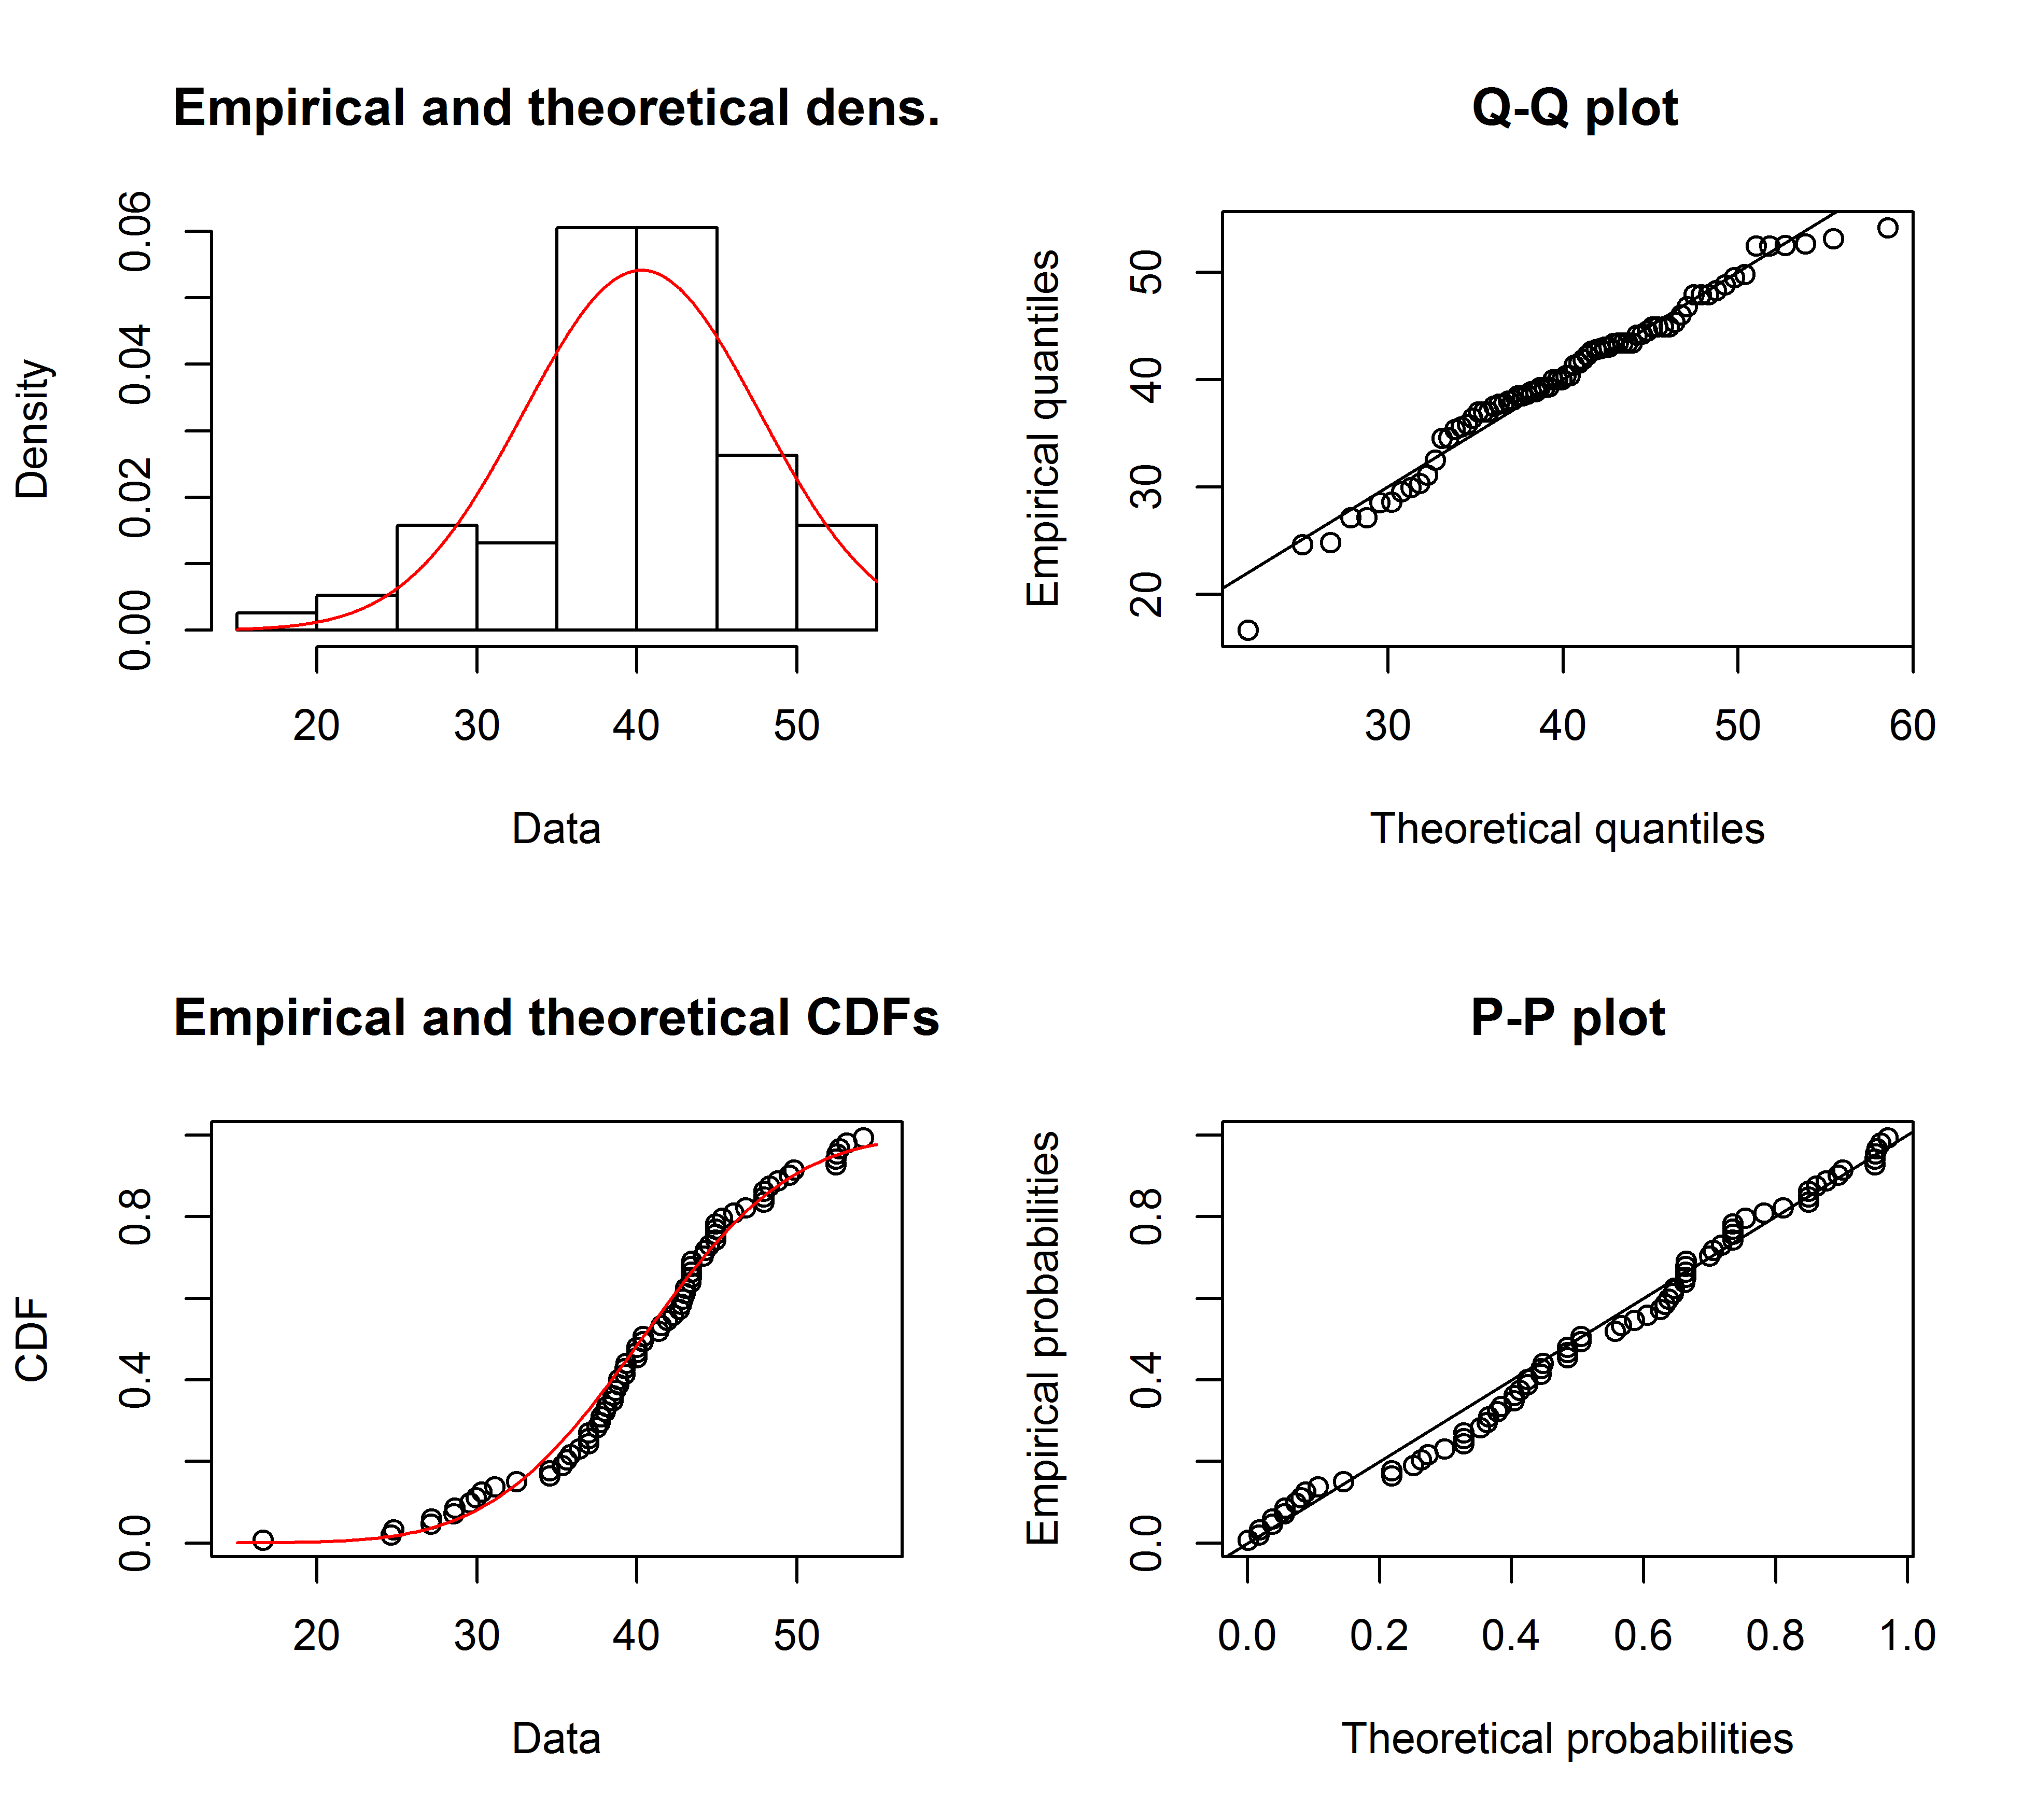
Now inspect the fit for the normal:
plot(fit.norm)
And for the Weibull fit:
plot(fit.weibull)
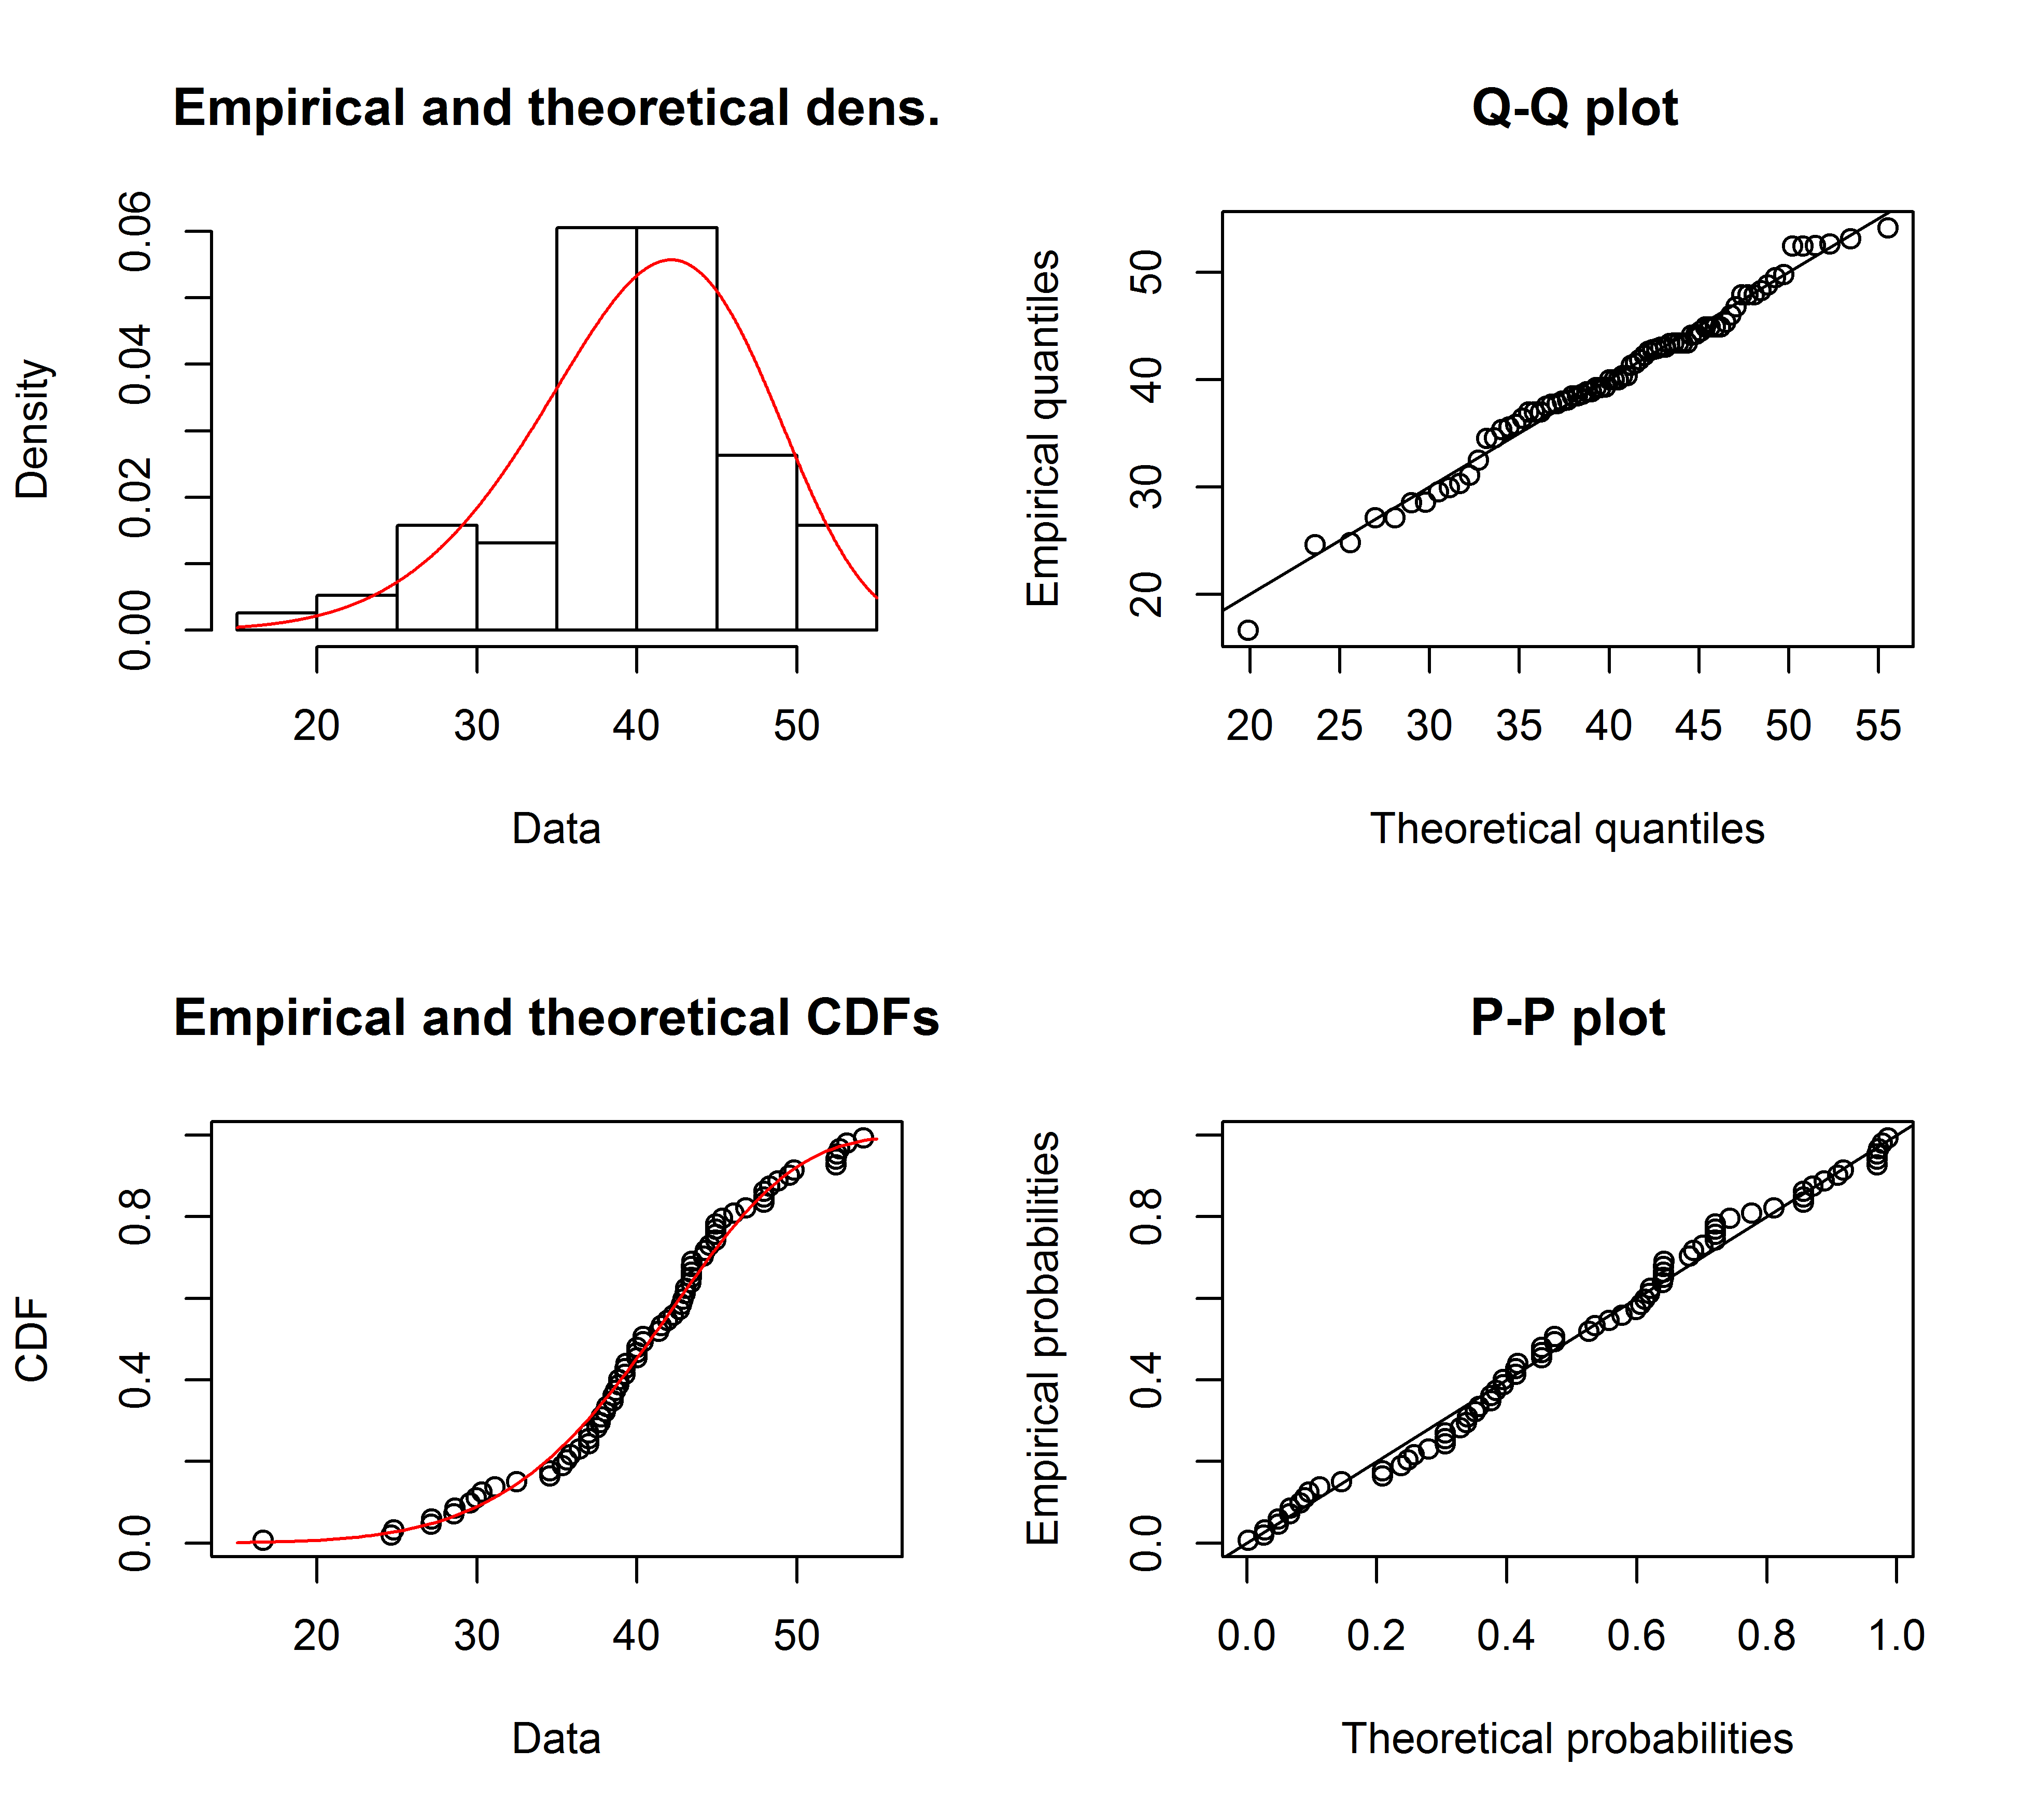
Both look good but judged by the QQ-Plot, the Weibull maybe looks a bit better, especially in the tails. Correspondingly, the AIC of the Weibull fit is lower compared with the normal fit:
fit.weibull$aic
[1] 519.8537

fit.norm$aic
[1] 523.3079
Kolmogorov-Smirnov test simulation
I will use @Aksakal's procedure explained here to simulate the KS-statistic under the null.
n.sims <- 5e4

stats <- replicate(n.sims, {
  r <- rweibull(n = length(x)
                , shape= fit.weibull$estimate["shape"]
                , scale = fit.weibull$estimate["scale"]
  )
  estfit.weibull <- fitdist(r, "weibull") # added to account for the estimated parameters
  as.numeric(ks.test(r
                     , "pweibull"
                     , shape= estfit.weibull$estimate["shape"]
                     , scale = estfit.weibull$estimate["scale"])$statistic
  )
})
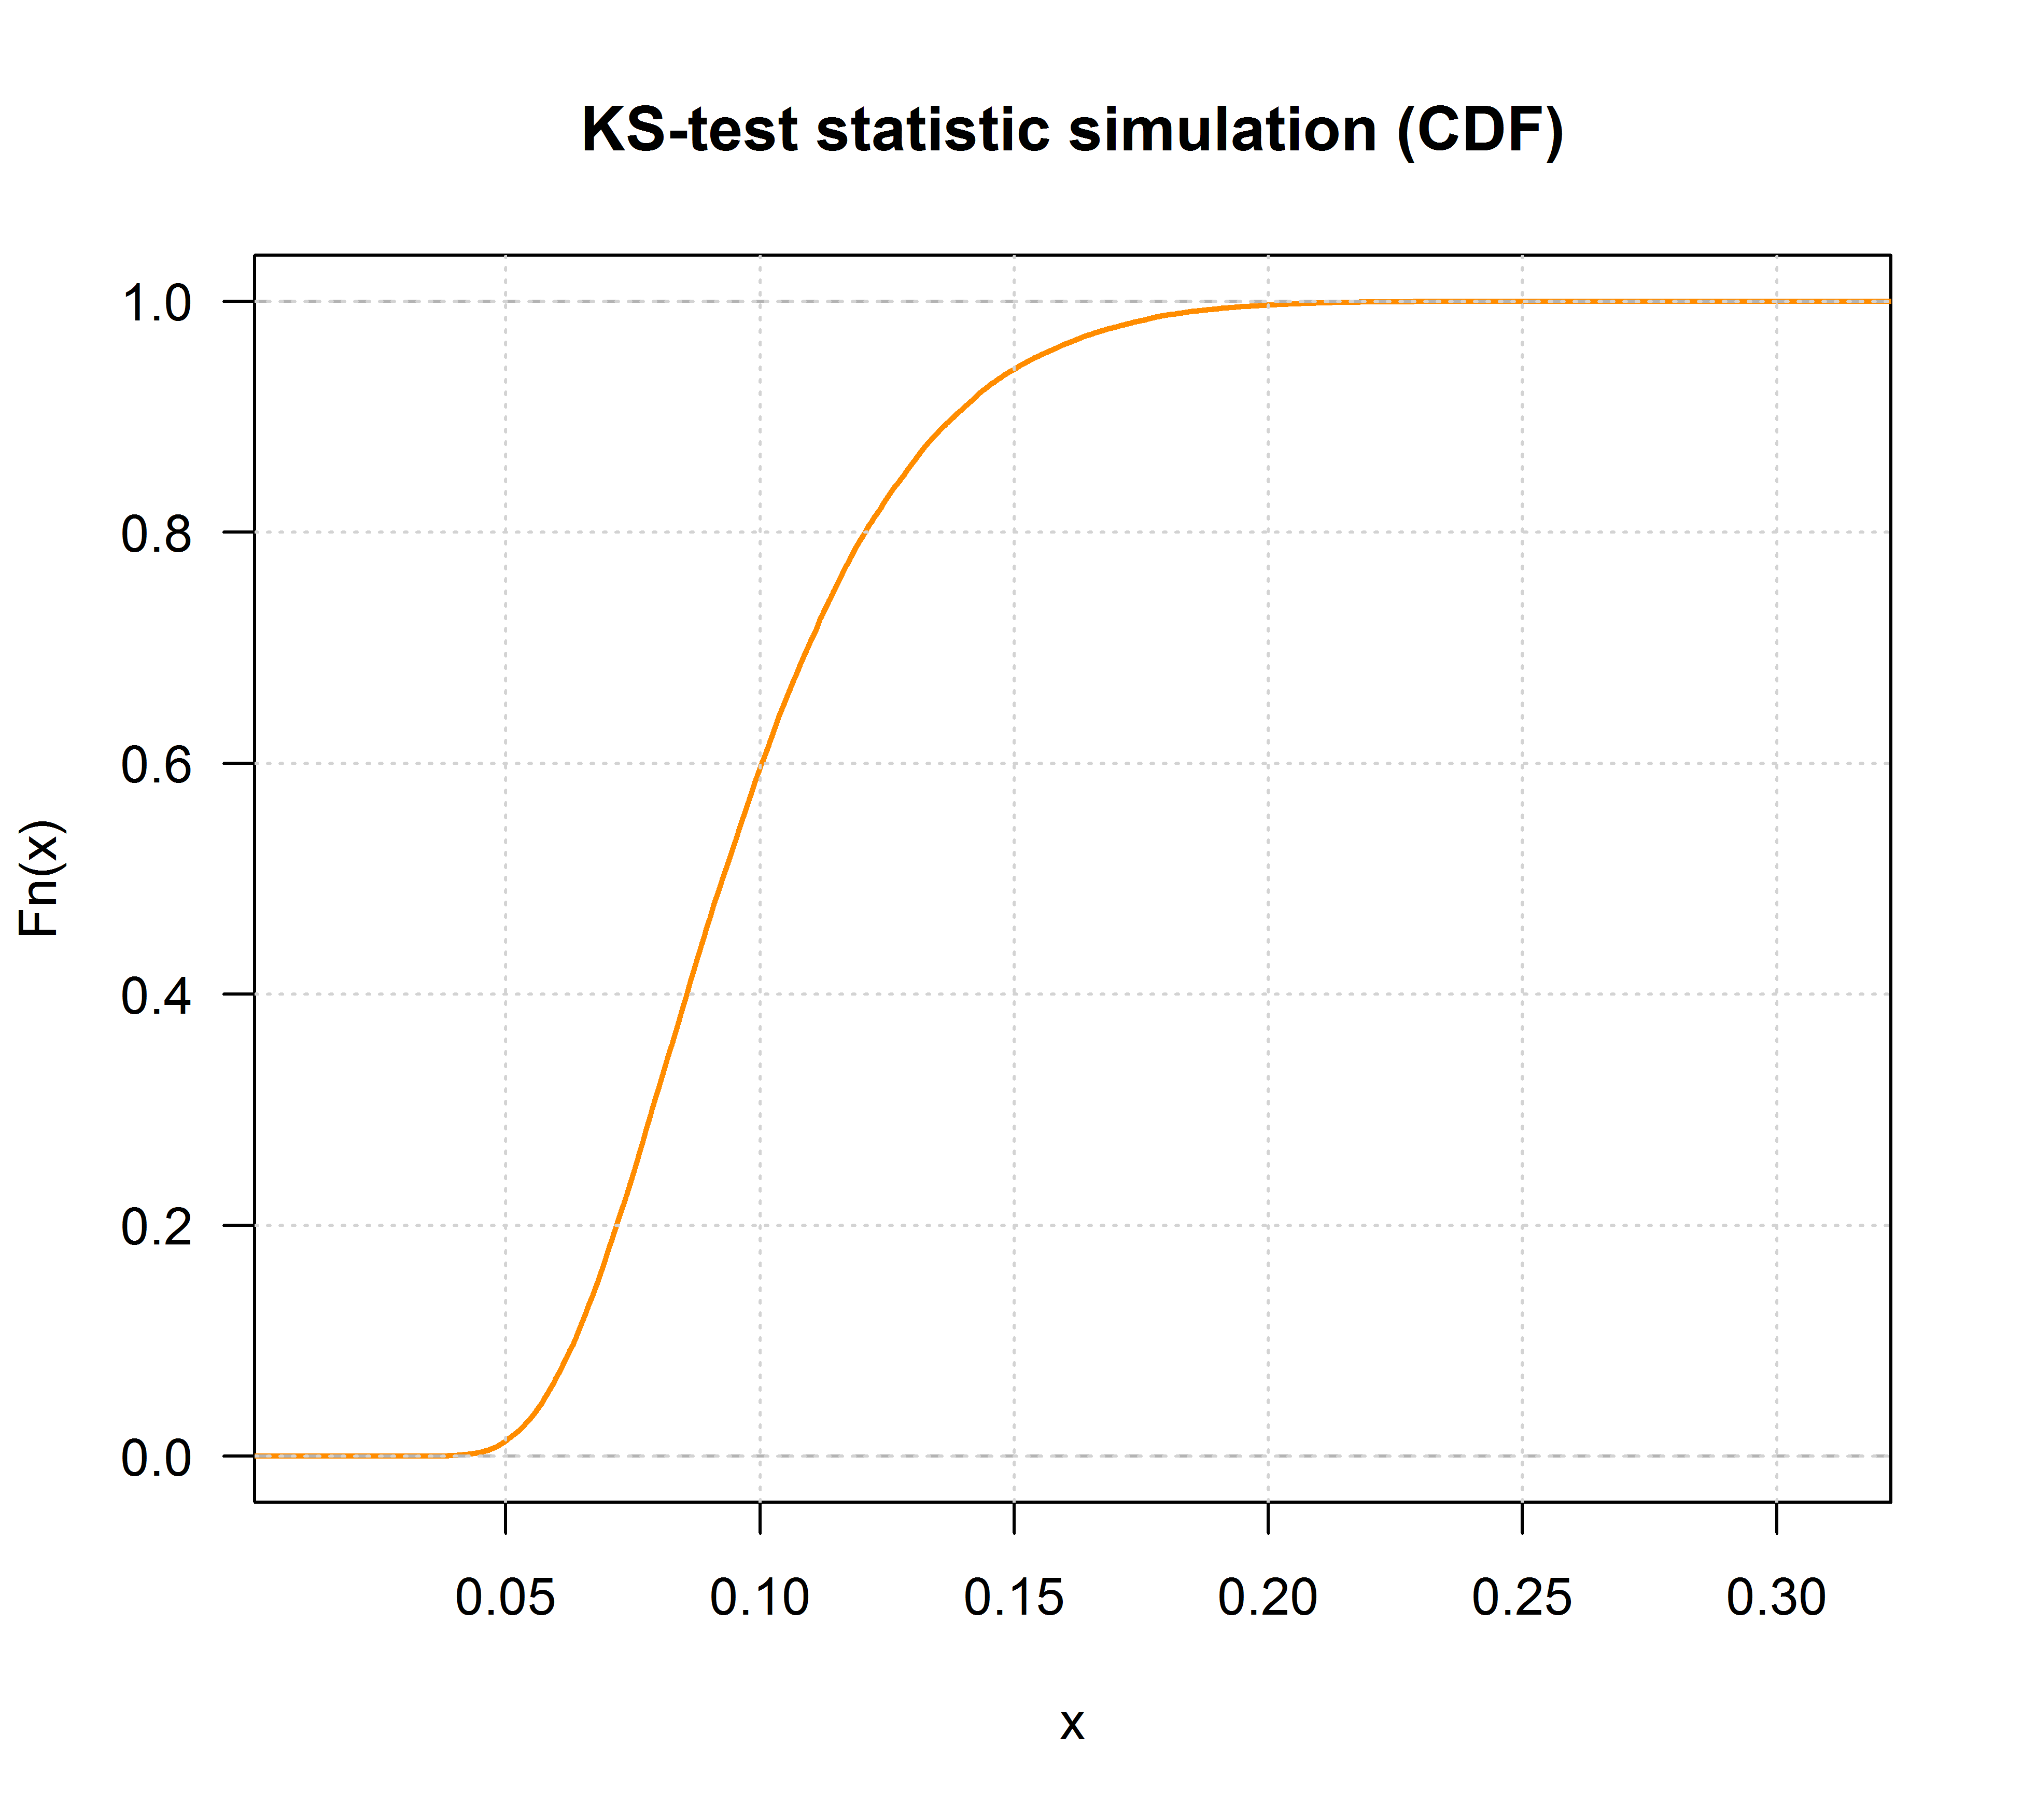
The ECDF of the simulated KS-statistics looks as follows:
plot(ecdf(stats), las = 1, main = "KS-test statistic simulation (CDF)", col = "darkorange", lwd = 1.7)
grid()
Finally, our $p$-value using the simulated null distribution of the KS-statistics is:
fit <- logspline(stats)

1 - plogspline(ks.test(x
                       , "pweibull"
                       , shape= fit.weibull$estimate["shape"]
                       , scale = fit.weibull$estimate["scale"])$statistic
               , fit
)

[1] 0.4889511
This confirms our graphical conclusion that the sample is compatible with a Weibull distribution.
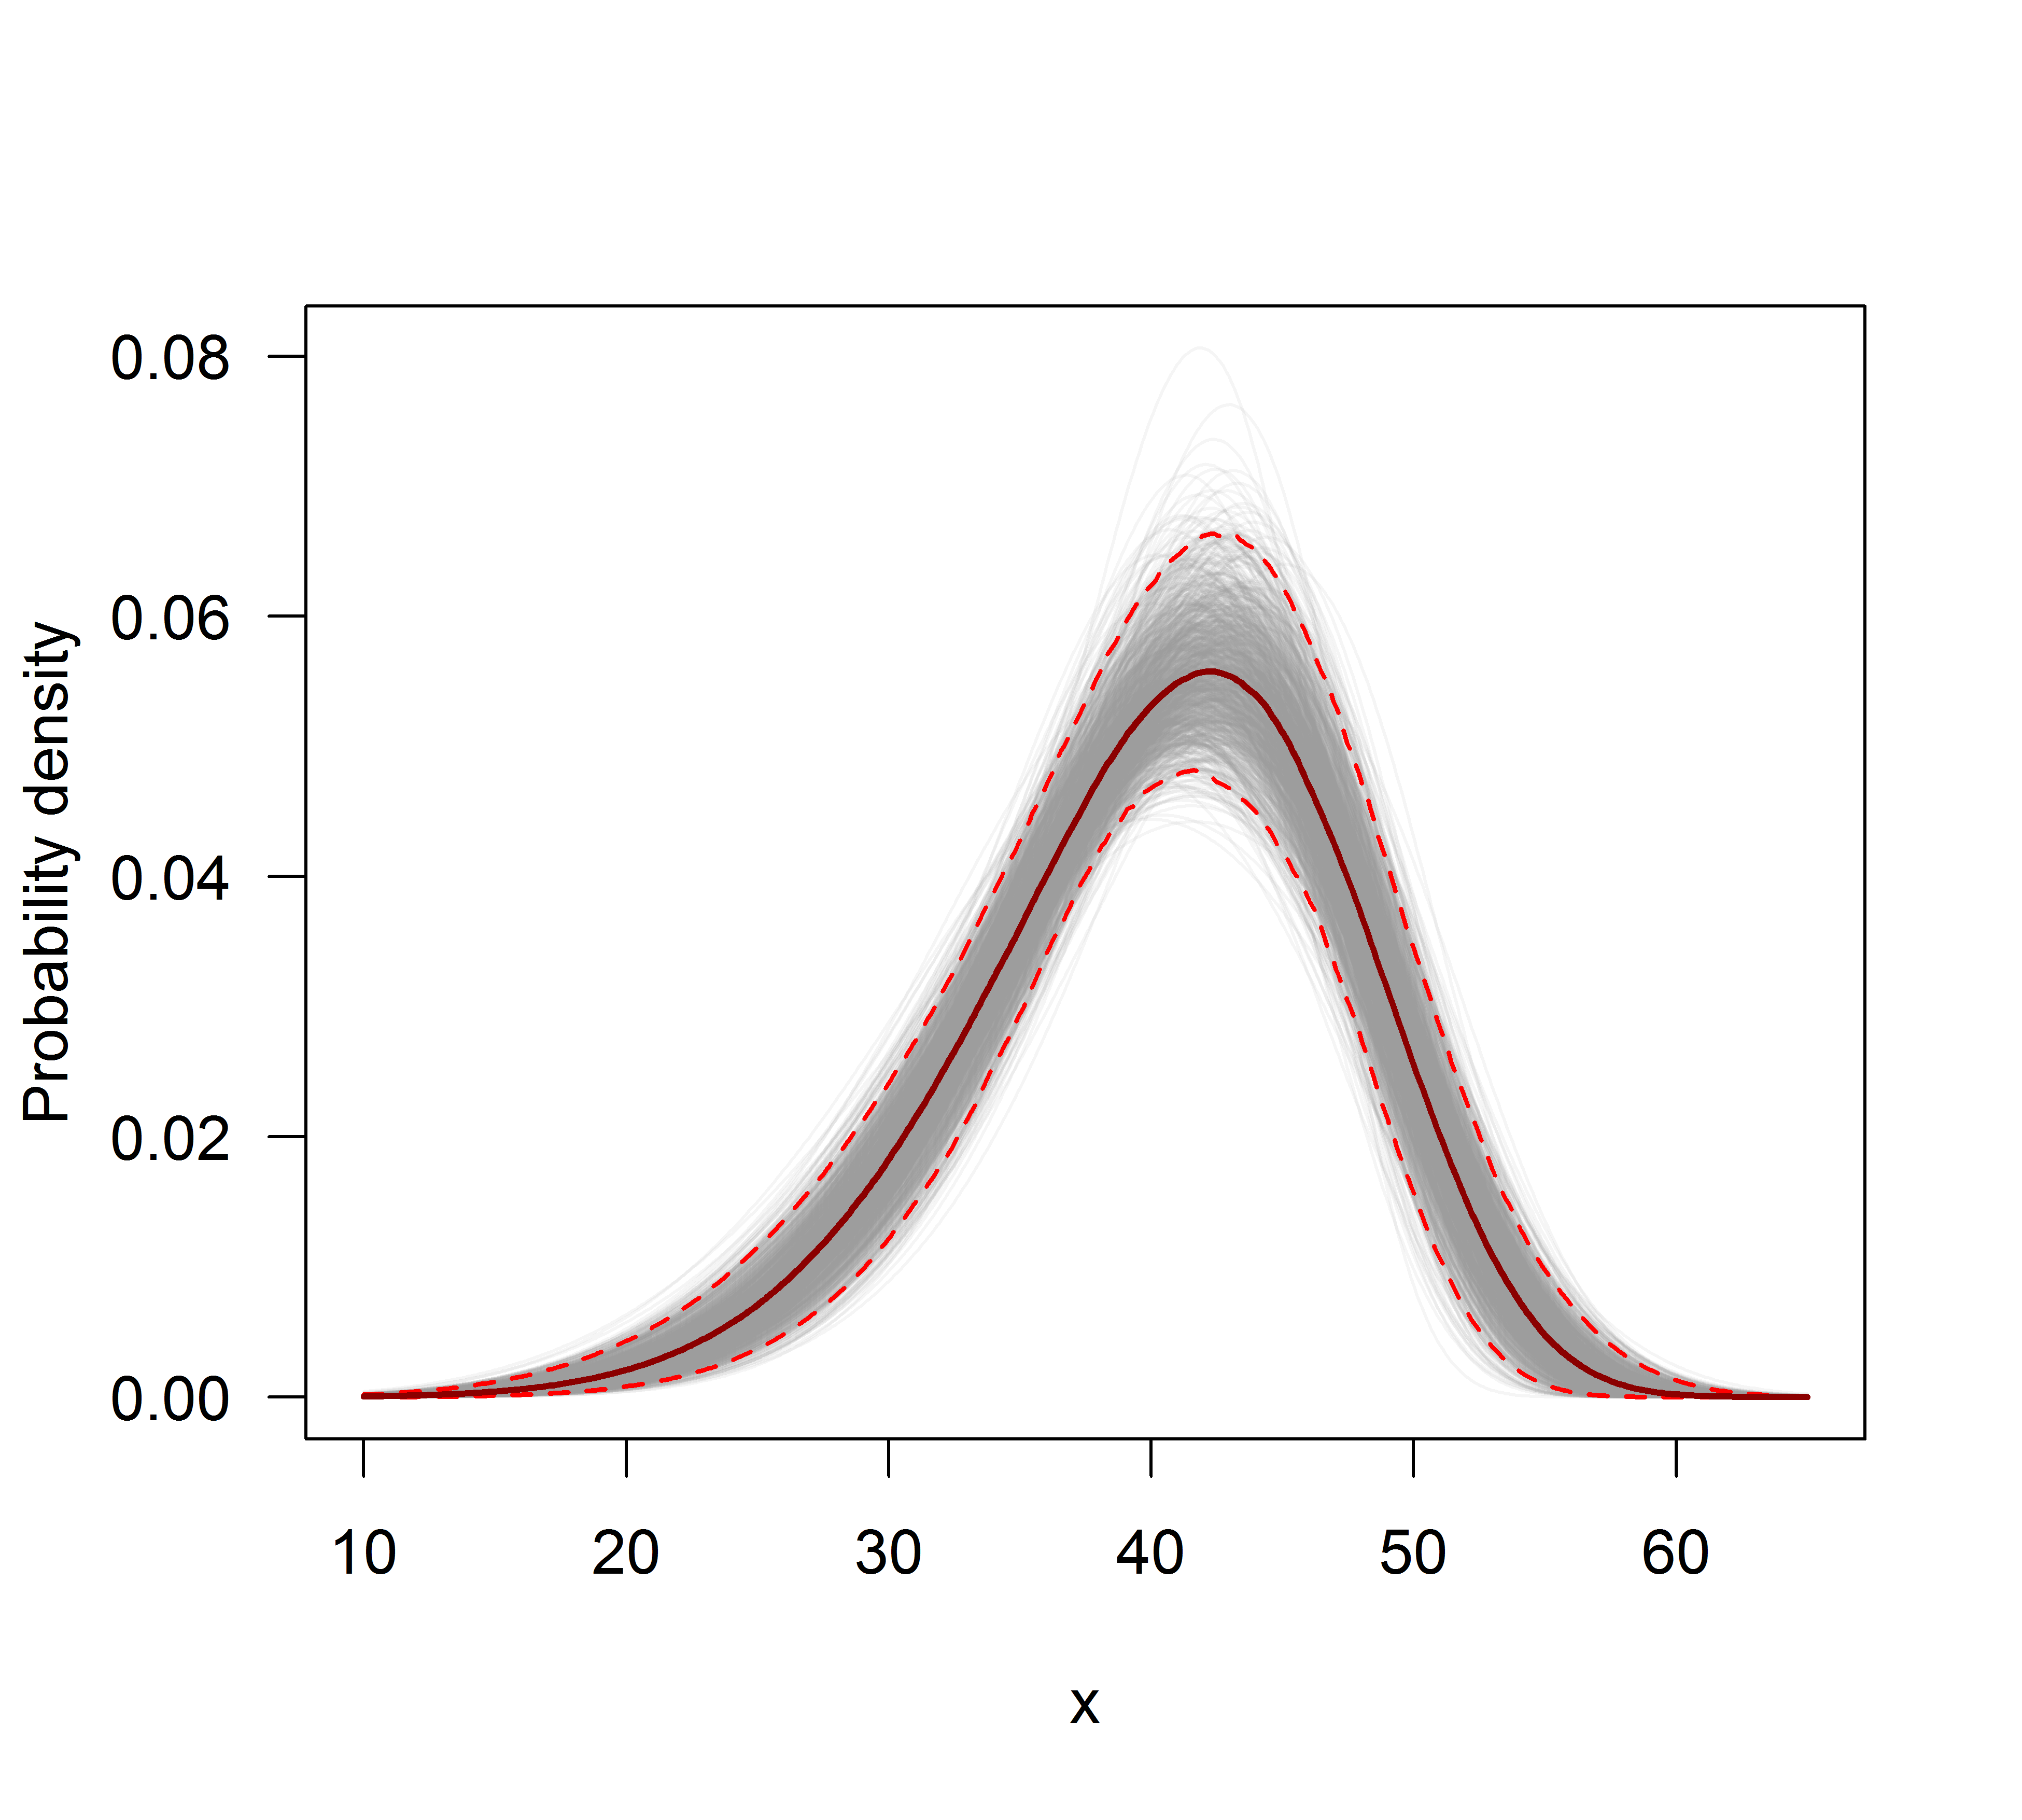
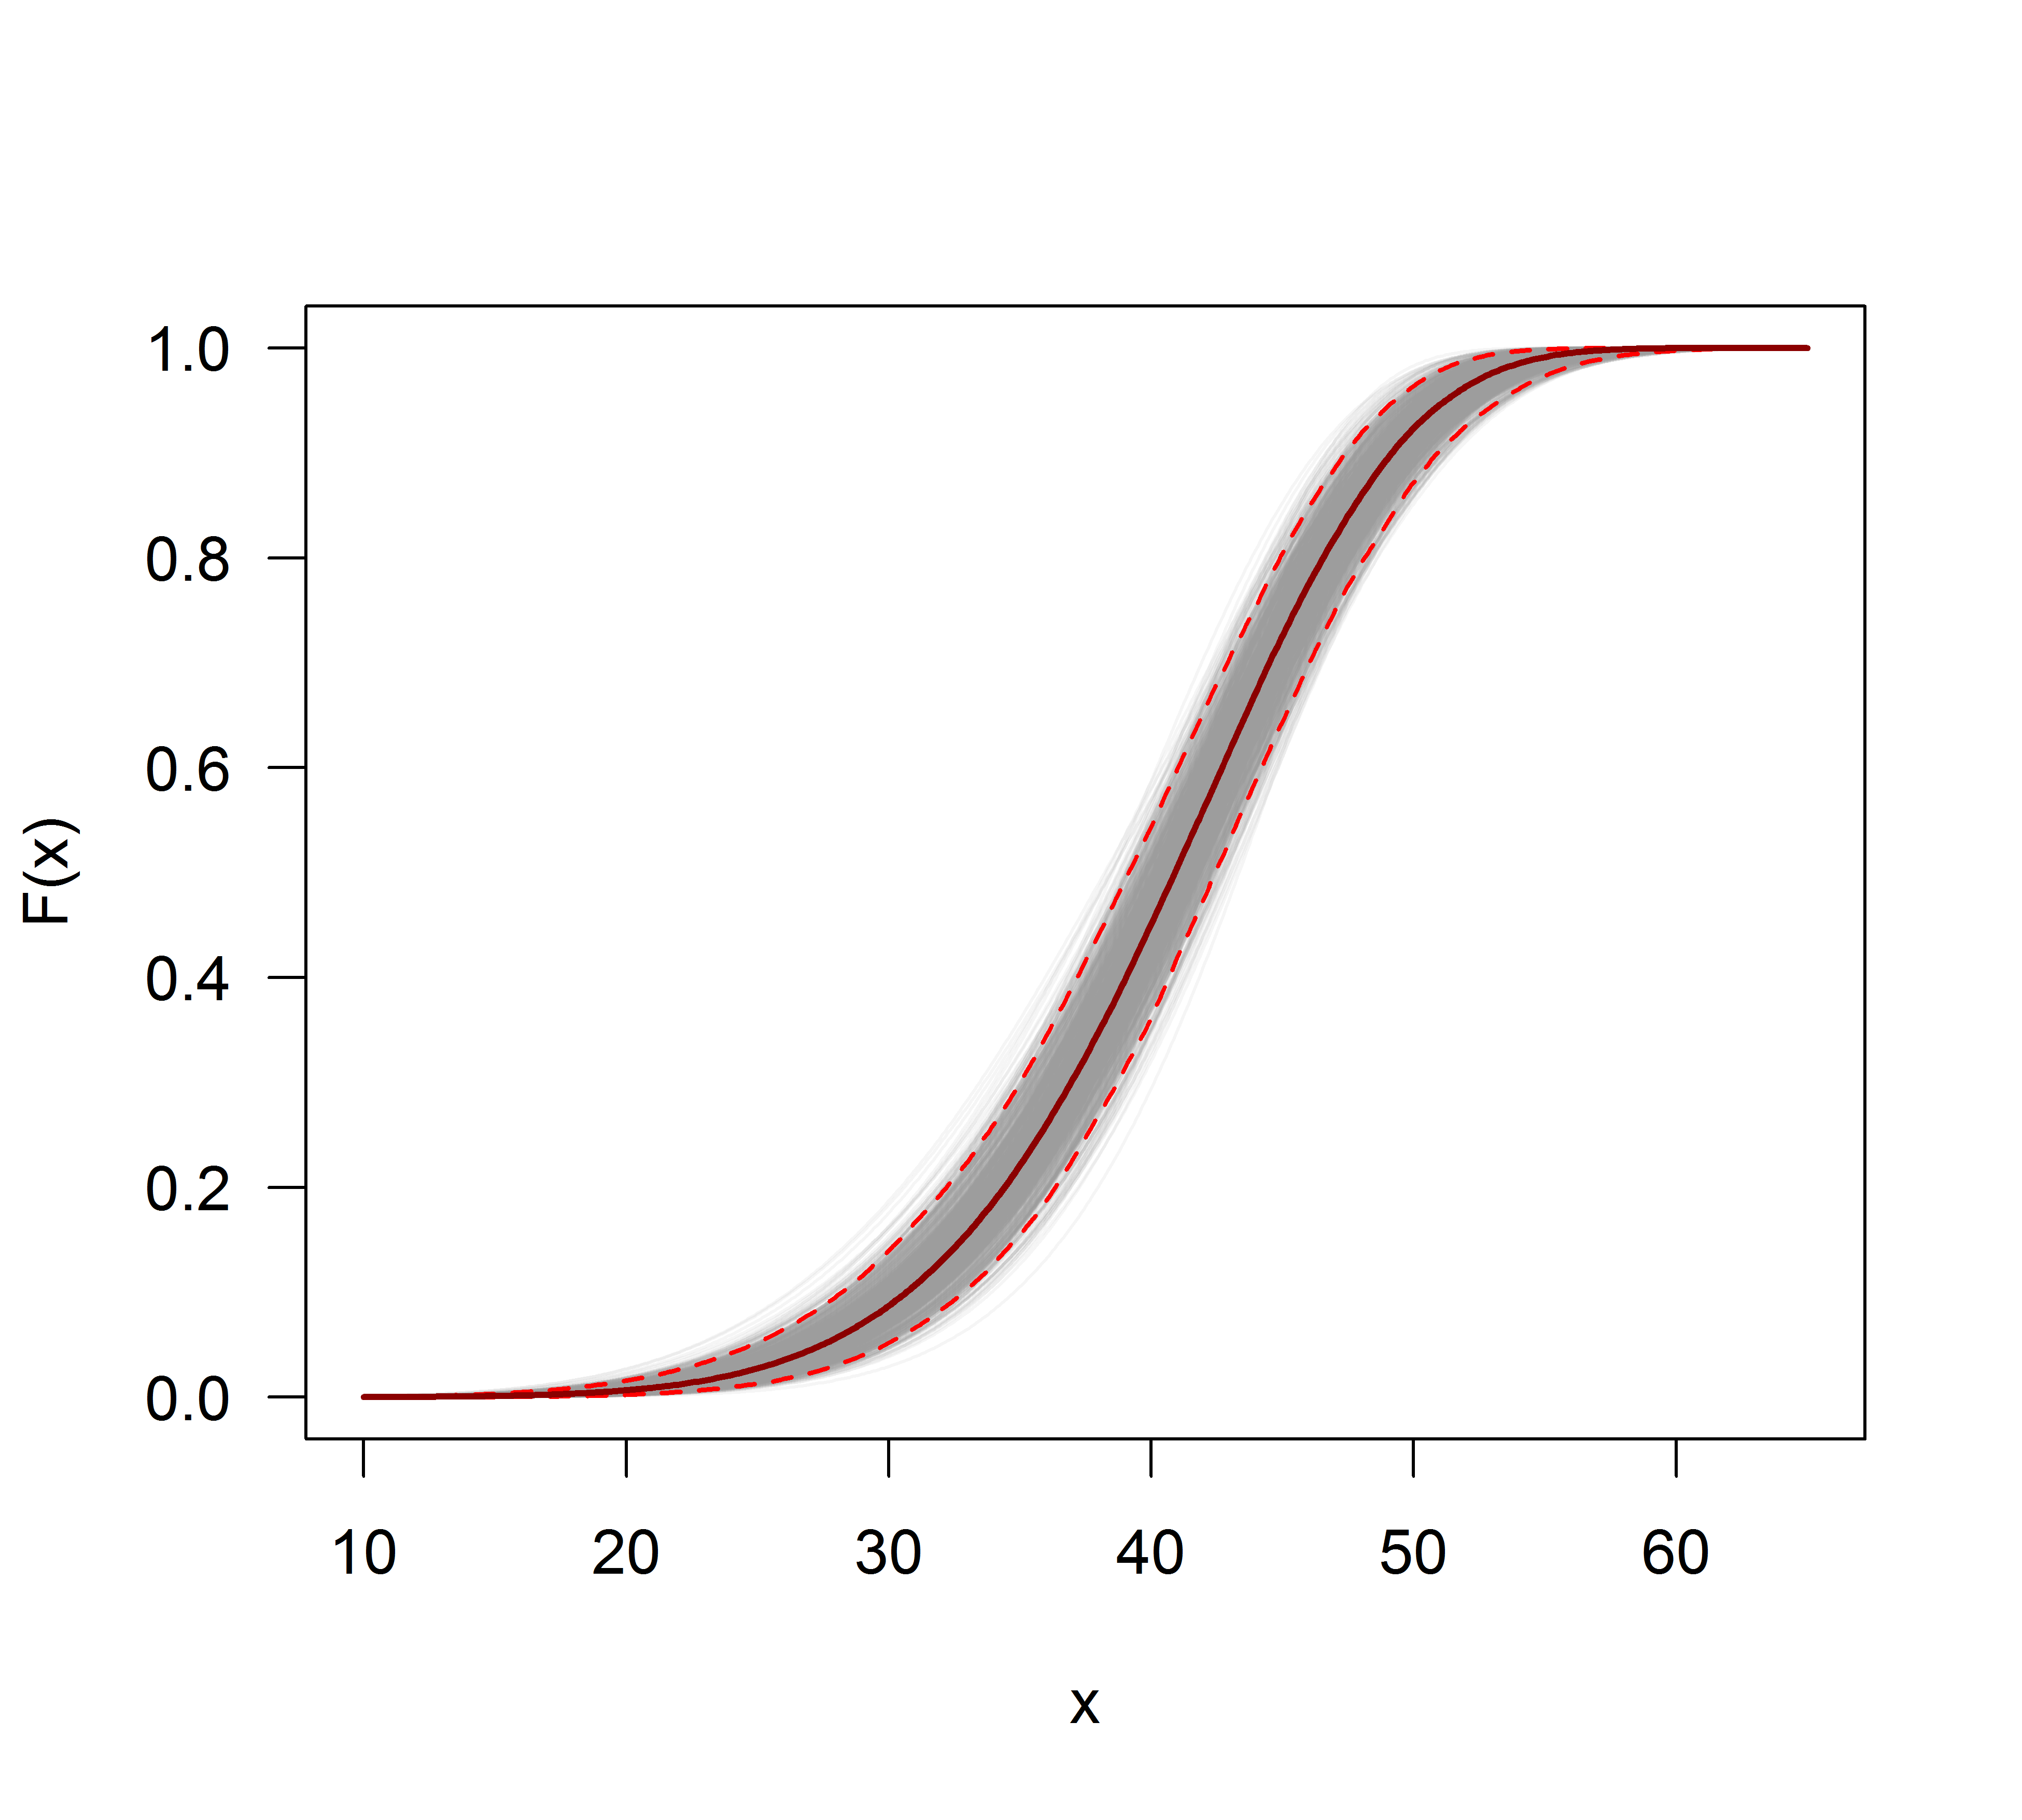
As explained here, we can use bootstrapping to add pointwise confidence intervals to the estimated Weibull PDF or CDF:
xs <- seq(10, 65, len=500)

true.weibull <- rweibull(1e6, shape= fit.weibull$estimate["shape"]
                         , scale = fit.weibull$estimate["scale"])

boot.pdf <- sapply(1:1000, function(i) {
  xi <- sample(x, size=length(x), replace=TRUE)
  MLE.est <- suppressWarnings(fitdist(xi, distr="weibull"))
  dweibull(xs, shape=MLE.est$estimate["shape"],  scale = MLE.est$estimate["scale"])
}
)

boot.cdf <- sapply(1:1000, function(i) {
  xi <- sample(x, size=length(x), replace=TRUE)
  MLE.est <- suppressWarnings(fitdist(xi, distr="weibull"))
  pweibull(xs, shape= MLE.est$estimate["shape"],  scale = MLE.est$estimate["scale"])
}
)

#-----------------------------------------------------------------------------
# Plot PDF
#-----------------------------------------------------------------------------

par(bg="white", las=1, cex=1.2)
plot(xs, boot.pdf[, 1], type="l", col=rgb(.6, .6, .6, .1), ylim=range(boot.pdf),
     xlab="x", ylab="Probability density")
for(i in 2:ncol(boot.pdf)) lines(xs, boot.pdf[, i], col=rgb(.6, .6, .6, .1))

# Add pointwise confidence bands

quants <- apply(boot.pdf, 1, quantile, c(0.025, 0.5, 0.975))
min.point <- apply(boot.pdf, 1, min, na.rm=TRUE)
max.point <- apply(boot.pdf, 1, max, na.rm=TRUE)
lines(xs, quants[1, ], col="red", lwd=1.5, lty=2)
lines(xs, quants[3, ], col="red", lwd=1.5, lty=2)
lines(xs, quants[2, ], col="darkred", lwd=2)
#-----------------------------------------------------------------------------
# Plot CDF
#-----------------------------------------------------------------------------

par(bg="white", las=1, cex=1.2)
plot(xs, boot.cdf[, 1], type="l", col=rgb(.6, .6, .6, .1), ylim=range(boot.cdf),
     xlab="x", ylab="F(x)")
for(i in 2:ncol(boot.cdf)) lines(xs, boot.cdf[, i], col=rgb(.6, .6, .6, .1))

# Add pointwise confidence bands

quants <- apply(boot.cdf, 1, quantile, c(0.025, 0.5, 0.975))
min.point <- apply(boot.cdf, 1, min, na.rm=TRUE)
max.point <- apply(boot.cdf, 1, max, na.rm=TRUE)
lines(xs, quants[1, ], col="red", lwd=1.5, lty=2)
lines(xs, quants[3, ], col="red", lwd=1.5, lty=2)
lines(xs, quants[2, ], col="darkred", lwd=2)
#lines(xs, min.point, col="purple")
#lines(xs, max.point, col="purple")
Automatic distribution fitting with GAMLSS
The gamlss package for R offers the ability to try many different distributions and select the "best" according to the GAIC (the generalized Akaike information criterion). The main function is fitDist. An important option in this function is the type of the distributions that are tried. For example, setting type = "realline" will try all implemented distributions defined on the whole real line whereas type = "realsplus" will only try distributions defined on the real positive line. Another important option is the parameter $k$, which is the penalty for the GAIC. In the example below, I set the parameter $k = 2$ which means that the "best" distribution is selected according to the classic AIC. You can set $k$ to anything you like, such as $\log(n)$ for the BIC.
library(gamlss)
library(gamlss.dist)
library(gamlss.add)

x <- c(37.50,46.79,48.30,46.04,43.40,39.25,38.49,49.51,40.38,36.98,40.00,
       38.49,37.74,47.92,44.53,44.91,44.91,40.00,41.51,47.92,36.98,43.40,
       42.26,41.89,38.87,43.02,39.25,40.38,42.64,36.98,44.15,44.91,43.40,
       49.81,38.87,40.00,52.45,53.13,47.92,52.45,44.91,29.54,27.13,35.60,
       45.34,43.37,54.15,42.77,42.88,44.26,27.14,39.31,24.80,16.62,30.30,
       36.39,28.60,28.53,35.84,31.10,34.55,52.65,48.81,43.42,52.49,38.00,
       38.65,34.54,37.70,38.11,43.05,29.95,32.48,24.63,35.33,41.34)

fit <- fitDist(x, k = 2, type = "realplus", trace = FALSE, try.gamlss = TRUE)

summary(fit)

*******************************************************************
Family:  c("WEI2", "Weibull type 2")

Call:  gamlssML(formula = y, family = DIST[i], data = sys.parent())

Fitting method: "nlminb"


Coefficient(s):
             Estimate  Std. Error  t value   Pr(>|t|)
eta.mu    -24.3468041   2.2141197 -10.9962 < 2.22e-16 ***
eta.sigma   1.8661380   0.0892799  20.9021 < 2.22e-16 ***
According to the AIC, the Weibull distribution (more specifically WEI2, a special parametrization of it) fits the data best. The exact parameterization of the distribution WEI2 is detailed in this document on page 279. Let's inspect the fit by looking at the residuals in a worm plot (basically a de-trended Q-Q-plot):
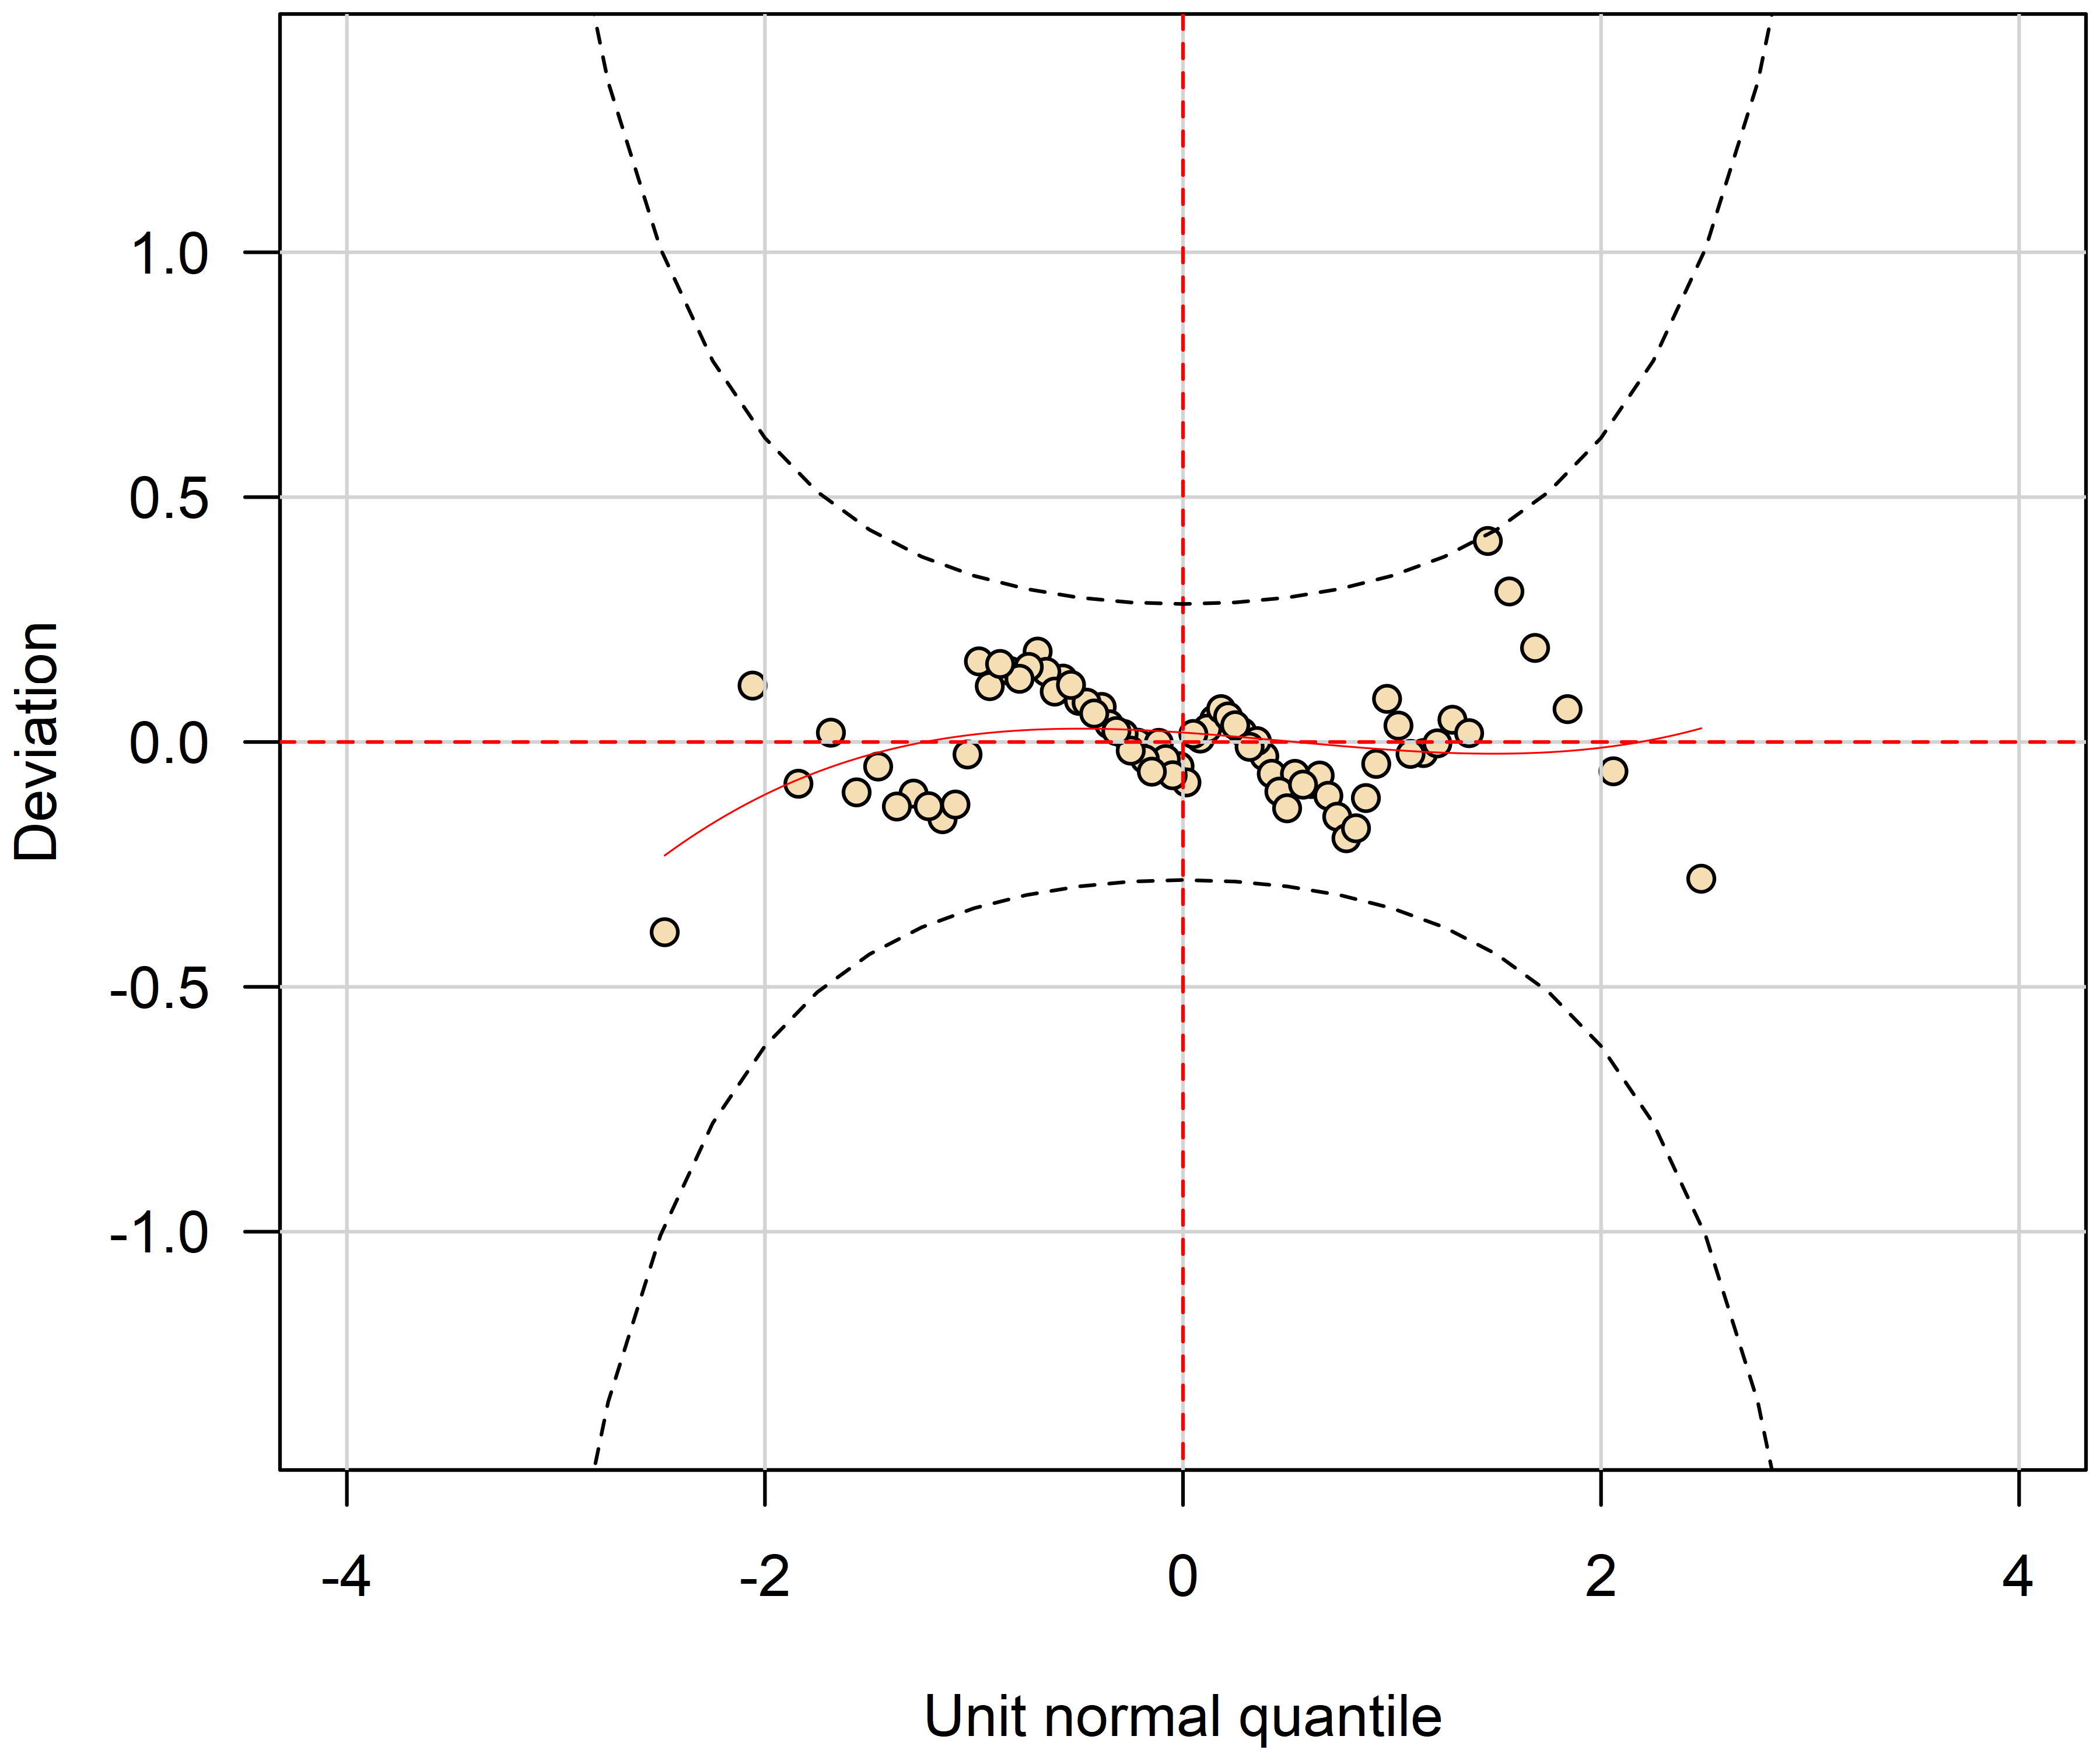
We expect the residuals to be close to the middle horizontal line and 95% of them to lie between the upper and lower dotted curves, which act as 95% pointwise confidence intervals. In this case, the worm plot looks fine to me indicating that the Weibull distribution is an adequate fit.


I used the fitdistr() function.....What'sfitdistrfunction? Something from Excel? Or something you wrote yourself in C? $\endgroup$