1
$\begingroup$

I have the following data. I want to know which distribution best fits the data. First, I tried to check it using the Cullen and Frey graph, here are the results:

> library(fitdistrplus)
> descdist(respm, discrete = FALSE, boot = 500)
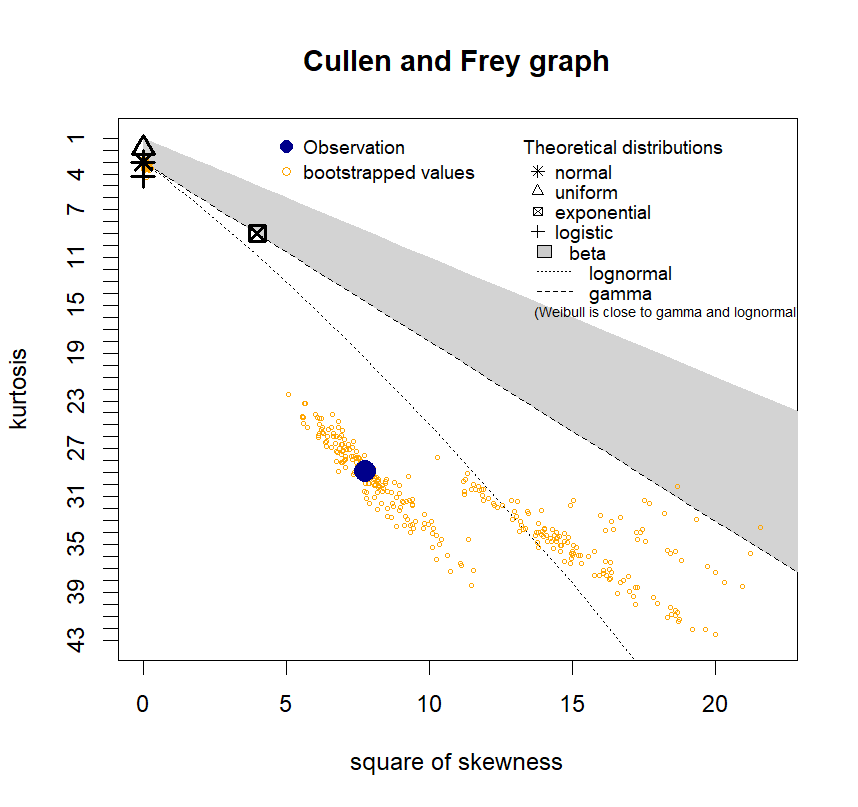
Cullen and Frey graph

However, from these results I am still confused about which distribution is suitable. and i tried to use fitdistrplus package to identify it. From the graph it can be seen that the observations are closer to the lognormal and gamma distributions, but I cannot use "lnorm" or "gamma" because my data has negative values.

> fn1 <- fitdist(respm, "gamma")
Error in computing default starting values.
Error in manageparam(start.arg = start, fix.arg = fix.arg, obs = data,  : 
  Error in startargdefault(obs, distname) : 
  values must be positive to fit an gamma  distribution

I tried using other distributions such as "norm" and "logis", but after running there was an error.

> fn1 <- fitdist(respm, "norm")
<simpleError in optim(par = vstart, fn = fnobj, fix.arg = fix.arg, 
  obs = data,     gr = gradient, ddistnam = ddistname, hessian = TRUE, 
   method = meth,     lower = lower, upper = upper, ...): non-finite 
   finite-difference value [2]>   
 
   Error in fitdist(respm, "norm") : 
   the function mle failed to estimate the parameters, 
                with the error code 100

What solution should I do using R to get the distribution information that best fits my data?

$\endgroup$
6
  • 2
    $\begingroup$ R is just a calculator. It can't tell you what to do. You need to decide what statistical method you want to use to model your data. There's not one universal way to do that. You should ask for statistical advice over at Cross Validated instead. This is not a specific programming question that's appropriate for Stack Overflow. $\endgroup$
    – MrFlick
    Commented Jun 15, 2023 at 17:16
  • 4
    $\begingroup$ Could you please explain what you are trying to achieve by fitting any distribution to your data? $\endgroup$
    – whuber
    Commented Jun 15, 2023 at 18:47
  • $\begingroup$ First, since all your values are between 0 and some multiple of 10^{-13), I would first multiply everything by 10^13. Then, I would plot a lot of quantile plots against different theoretical distributions. But maybe none will be close. That happens a lot. $\endgroup$
    – Peter Flom
    Commented Jun 15, 2023 at 19:41
  • 1
    $\begingroup$ Please, please, draw a Normal probability plot of the data. You will immediately see it has one high outlier and the remaining 357 values closely follow a Normal distribution (despite their discreteness: they are all multiples of 7.105427E-15). This fact, by the way, tells us there's a lot of relevant information about these data you ought to be disclosing if you really want good answers, such as what the data represent and how they were measured. $\endgroup$
    – whuber
    Commented Jun 15, 2023 at 21:14
  • $\begingroup$ I'm trying to analyze using copula, and I need information on the marginal distribution and the parameter values of the marginal distributions. I use 2 data in the form of residual reconstruction results from the previous step (hybrid method). The data above is one of the data that I use. $\endgroup$
    – nahhhhh
    Commented Jun 16, 2023 at 4:19

0

Browse other questions tagged or ask your own question.