13
$\begingroup$

Is there an R package that I can use to explore whether there exist relationships between variables?

Typically when I am looking for patterns I look at correlations, and then a facet plot. Then I manually apply some transformations to variables in the data. I was wondering if I could accelerate this process through an R package.

$\endgroup$
1
  • $\begingroup$ If you have your own process, you could always roll your own package. Or just a reusable function in some file loaded at the beginning of your script. $\endgroup$ Commented Aug 11, 2011 at 3:33

6 Answers 6

9
$\begingroup$

AFAIK, no. To be more precise, I don't know of a single R package that would do part of what is called Exploratory Data Analysis (EDA) for you through a single function call -- I'm thinking of the re-expression and revelation aspects discussed in Hoaglin, Mosteller and Tukey, Understanding Robust and Exploratory Data Analysis. Wiley-Interscience, 1983, in particular.

However, there exist some nifty alternatives in R, especially regarding interactive exploration of data (Look here for interesting discussion: When is interactive data visualization useful to use?). I can think of

  • iplots, or its successor Acinonyx, for interactive visualization (allowing for brushing, linked plots, and the like) (Some of these functionalities can be found in the latticist package; finally, rgl is great for 3D interactive visualization.)
  • ggobi for interactive and dynamic displays, including data reduction (Multidimensional scaling) and Projection Pursuit

This is only for interactive data exploration, but I would say this is the essence of EDA. Anyway, the above techniques might help when exploring bivariate or higher-order relationships between numerical variables. For categorical data, the vcd package is a good option (visualization and summary tables). Then, I would say than the vegan and ade4 packages come first for exploring relationships between variables of mixed data types.

Finally, what about data mining in R? (Try this keyword on Rseek)

$\endgroup$
4
  • $\begingroup$ (+1) Nice to see you back answering questions! $\endgroup$
    – whuber
    Commented Aug 10, 2011 at 22:24
  • $\begingroup$ +1 Btw: little typo - Acinonyx (i & y are transposed). $\endgroup$
    – Iterator
    Commented Aug 12, 2011 at 13:21
  • $\begingroup$ @Iterator Thanks for catching the typo. (I've already +1 your response, good that you cited Wilkinson's paper). $\endgroup$
    – chl
    Commented Aug 12, 2011 at 15:40
  • 2
    $\begingroup$ There's now loon also waddella.github.io/loon Credit goes to @hadleywickham for pointing this out. $\endgroup$ Commented Dec 1, 2015 at 10:28
11
$\begingroup$

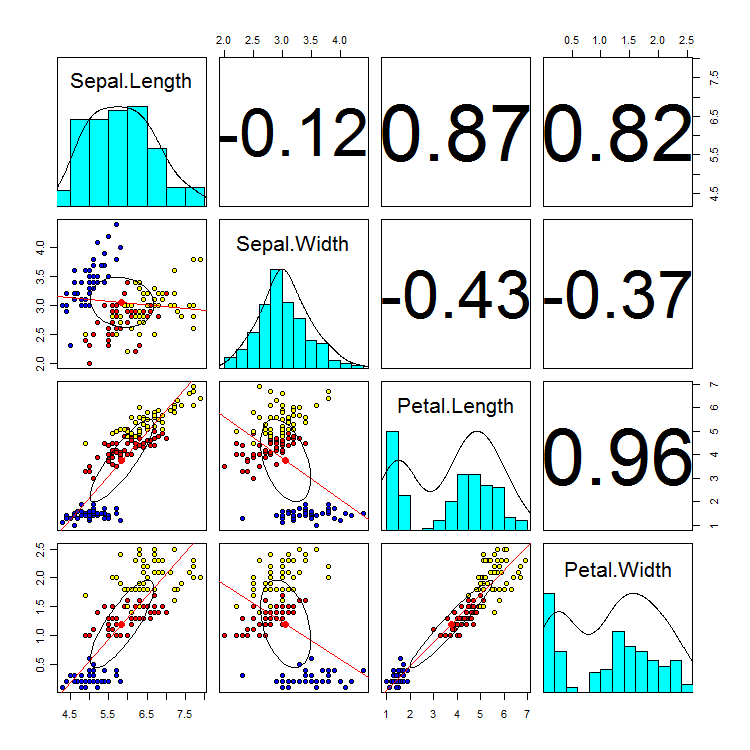
If you just want to get a quick look at how variables in your dataset are correlated, take a look at the pairs() function, or even better, the pairs.panels() function in the psych package. I wrote a little about the pairs function here.

Using the pairs() or psych::pairs.panels() function it's pretty easy to make scatterplot matrices.

pairs.panels(iris[-5], bg=c("blue","red","yellow")[iris$Species], pch=21,lm=TRUE)

enter image description here

$\endgroup$
0
7
$\begingroup$

Check out the scagnostics package and the original research paper. This is very interesting for bivariate relationships. For multivariate relationships, projection pursuit is a very good first step.

In general, though, domain and data expertise will both narrow and improve your methods for quickly investigating relationships.

$\endgroup$
7
$\begingroup$

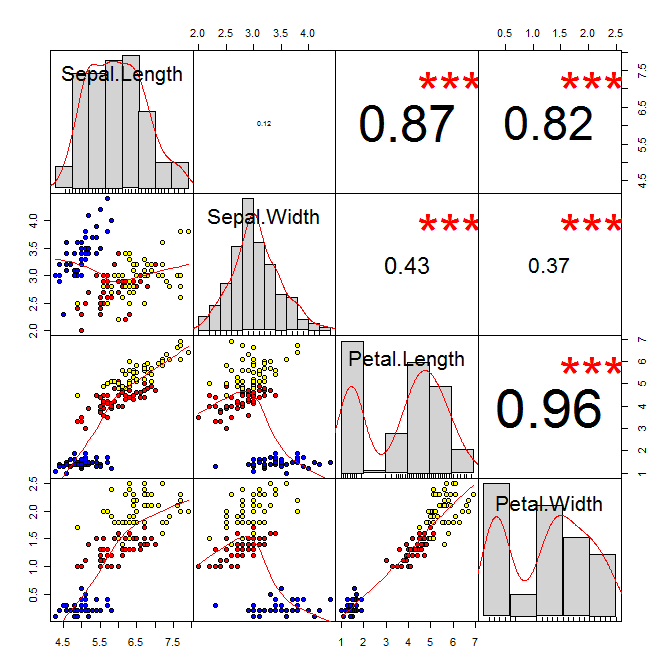
The chart.Correlation function in PerformanceAnalytics provides similar functionality to the plot.pairs function @Stephen Turner mentioned, except it smooths with a loess function rather than a linear model, and the significance for the correlations.

library(PerformanceAnalytics)
chart.Correlation(iris[-5], bg=c("blue","red","yellow")[iris$Species], pch=21)

Chart

$\endgroup$
5
$\begingroup$

If you are looking for possible transformations to work with correlation, then a tool that has not been mentioned yet that may be useful is ace which can be found in the acepack package (and probably other packages as well). This does an interative process of trying many different transformations (using smoothers) to find the transformations to maximize the correlation between a set of x variables and a y variable. Plotting the transformations can then suggest meaningful transformations.

$\endgroup$
2
$\begingroup$

You can use the DCOR function in the 'energy' package to compute a measure of non-linear dependency called distance correlation and plot as above. The issue with Pearson's correlation is that it can only detect linear-relationships between variables. Make sure you choose the write parameter for index in the DCOR function that said.

$\endgroup$

Not the answer you're looking for? Browse other questions tagged or ask your own question.