4
$\begingroup$

Is there a statistical test tat can test for similarity between two data sets on a count data?

The only test I can think of doing on a count data is chi squared test and fisher exact test and both test for differences between the two data sets.

I don't think I can use the P value for similarity as 1 - (p value of difference), can I ?

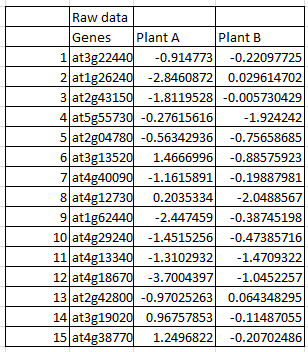
My actual data is as follows:

enter image description here enter image description here

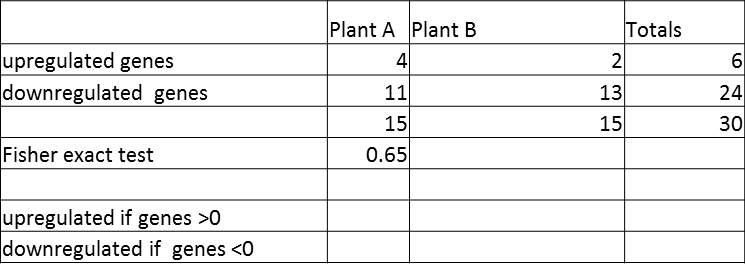
Alterrnatively the data can be arranged in the table below:

enter image description here

$\endgroup$
15
  • $\begingroup$ What's a 'p-value for similarity'? What test statistic? What's the null, and what's the alternative? $\endgroup$
    – Glen_b
    Commented Apr 13, 2015 at 14:01
  • $\begingroup$ Null Hypothesis: treatment A bears no similarity to treatment b. Response yes in treatment A can equally be response yes or response no in treatment b. $\endgroup$ Commented Apr 13, 2015 at 14:07
  • $\begingroup$ Aletrnative hypothesis: Response in treatment A is similiar to response in treatment b. so response Yes in treatment A is likely to be response yes in treatment B. $\endgroup$ Commented Apr 13, 2015 at 14:09
  • 1
    $\begingroup$ I think the OP is asking for a null hypothesis of data having a difference, and alternate of they being the same..something along the lines of equivalence testing if I am not wrong? but for count data, and not population distributions. $\endgroup$
    – Rover Eye
    Commented Apr 13, 2015 at 16:29
  • 1
    $\begingroup$ Can you post an example of your data? What are your variables? Do you have a contingency table? $\endgroup$ Commented Apr 13, 2015 at 16:37

1 Answer 1

5
$\begingroup$

The question you are asking is about agreement. You may want to check out John Uebersax's website on agreement. You need to think in terms of the format of your second contingency table, because your data are matched in the sense that the observations are of the same genes. The test you want is Cohen's kappa. In R, it could be done like this:

library(irr)                         # you need to use this package
dat = matrix(c(rep(c("u", "d"), 4),  # here I input your data
               rep(c("d", "u"), 2),
               rep(c("d", "d"), 9) ), ncol=2, byrow=T)
dat
#       [,1] [,2]
#  [1,] "u"  "d" 
#  [2,] "u"  "d" 
#  [3,] "u"  "d" 
#  [4,] "u"  "d" 
#  [5,] "d"  "u" 
#  [6,] "d"  "u" 
#  [7,] "d"  "d" 
#  [8,] "d"  "d" 
#  [9,] "d"  "d" 
# [10,] "d"  "d" 
# [11,] "d"  "d" 
# [12,] "d"  "d" 
# [13,] "d"  "d" 
# [14,] "d"  "d" 
# [15,] "d"  "d" 
kappa2(dat)  # this is the test, you have (non-significant) disagreement
#  Cohen's Kappa for 2 Raters (Weights: unweighted)
# 
#  Subjects = 15 
#    Raters = 2 
#     Kappa = -0.216 
#         z = -0.916 
#   p-value = 0.36 
$\endgroup$
1
  • $\begingroup$ You're welcome, @afreensahiri. $\endgroup$ Commented Apr 13, 2015 at 18:31

Your Answer

By clicking “Post Your Answer”, you agree to our terms of service and acknowledge you have read our privacy policy.

Not the answer you're looking for? Browse other questions tagged or ask your own question.