I am having difficulty finding a correct glm model to fit my data.
The outcome is the length of time in months a person will spend in prison (sentence length). It's technically a count, all positive integer values, although there are no zeros (I modeled those separately). It is censored at 600 - 50 years, a "life" sentence. The data are badly overdispersed - mean is 53 and the variance is 7338.
I have approached the data using a heckman two-step model where I first fit a probit model to predict who gets prison and who does not and then calculated the inverse mills ratio which I included in the sentence length model to adjust for selection effects. The predictors are almost but not entirely the same across the two models. The differences in the models are meaningful, I didn't just "leave out" some variables from the selection model.
The data are hierarchical and I have hypotheses that relate to cross level interactions, but we can ignore this complexity for simplification purposes.
I am inclined to fit a negative binomial regression with a log link but the data are stripped of all the zeros, the lowest value possible is 12 (1 year in prison). I'm having a hell of a time getting the mixed effects negative binomial model to converge even using start values from the fixed effects model but that's another problem which is something I'll have to deal with if the negative binomial approach is the right one.
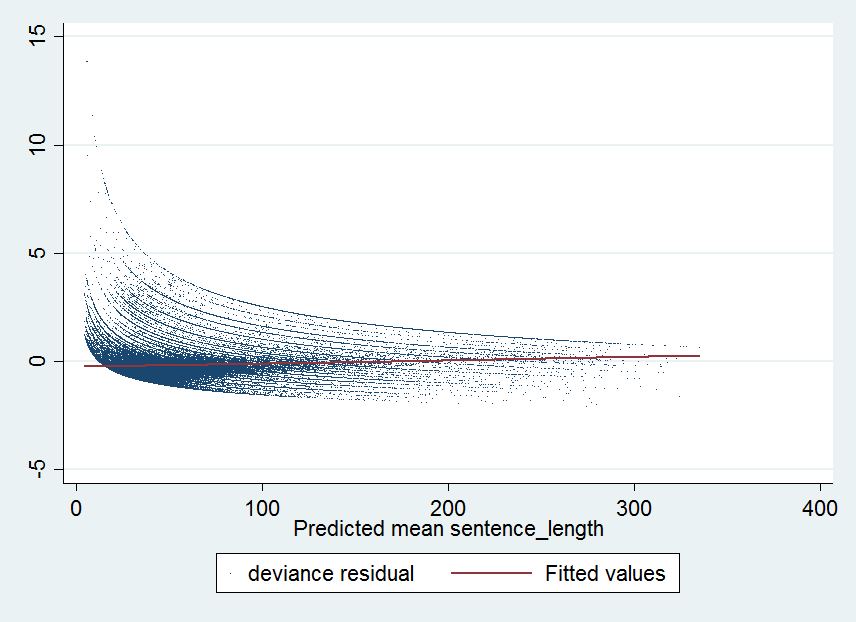
When I plot the deviance against the fitted value (mean response, not the linear prediction) from the negative binomial model with the log link I get this:

I think the large positive residuals at the low end of the predicted values are worrisome but am not sure what the remedy would be.
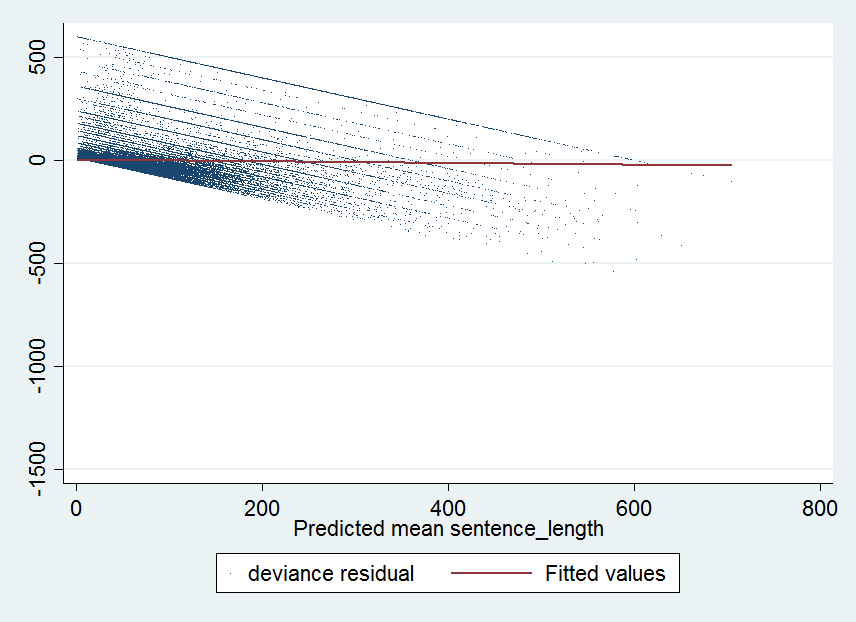
Now, the situation looks worse when modeled with a gaussian family and the log link. Here's the deviance vs. mean response for that model. These downward diagonal lines which I believe are indicative of the data being discrete are more pronounced and the residuals tend to be positive and low values and negative at high values.

These plots are from simplified fixed effects models without the interactions. I used Stata 14 to produce these results. I originally considered a gamma model with log link but that model is the least cooperative in converging and the deviance vs. fitted plot looks pretty much identical to the plot from the negative binomial model. A gaussian model with the identity link converges and produces coefficients that are literally 0 which is bizarre (I've never seen it) and must indicate incredibly poor model fit.
A negative binomial model on the whole set of data is not so great either, there are just so many zeros - about 80% of full the sample are zeros. And yes, it's a big dataset if you can't tell from the plots.
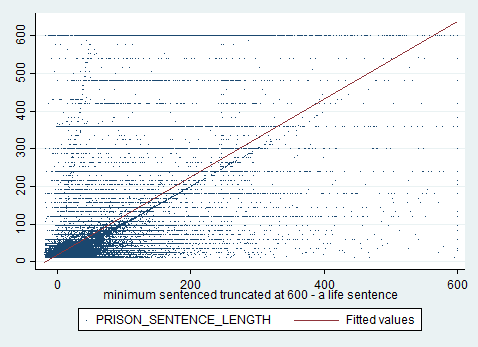
EDITED TO ADD: In hopes of getting a response, I'll add another plot that I think might be insightful. There is a variable I include in the analysis that reflects the minimum sentence a person is supposed to receive based on their overall "score" for the case (crime seriousness, victim injury, etc.). Here is a scatter plot of that score against the observed values and a regression line. You can see there's a clear linear relationship in the data and the fitted tracks it exactly parallel but the intercept places the line a bit high. You can also see the horizontal bars which I believe correspond to the diagonal lines in the residual vs. fitted plots. The bars correspond to widely used or common sentence terms. For example, the bar between 300 and 400 is 360 months - a 30 year sentence. There is also a pronounced line at 240 which would be a 20 year sentence. I'm guessing that these horizontal bars are the result of mandatory minimum sentences but they don't seem to be identified in the data, I'm not sure what to do about it.
Given that this is obviously one of the most important predictors in the model I'm thinking that I need to model the relationship as linear (because it looks linear) and not with a log link. This would rule out the negative binomial model at least as implemented in Stata's meglm command. But then I'm back to this issue with the data being censored at 12, strictly positive, and overdispersed.

Edited: I desperately need some advice about what direction to go. It seems like every glm specification is giving me biased estimates as indicated by the residuals being positive at low fitted values and negative at high fitted values. QQ plots likewise indicate non normality of the residuals which, I think, means that p values and confidence intervals are not accurate. The models just don't fit!
I've thought about boxcox transforming the predictor but am not sure how to go about that. I've thought about quantile regression which should be a bit more robust to non normal residuals. There's also hurdle models although I do not believe these will accommodate hierarchical data. There's also tobit, I could set 600 as an upper censor point but this doesn't resolve issues with the overdispersion of the data and the discrete nature of the outcome.
