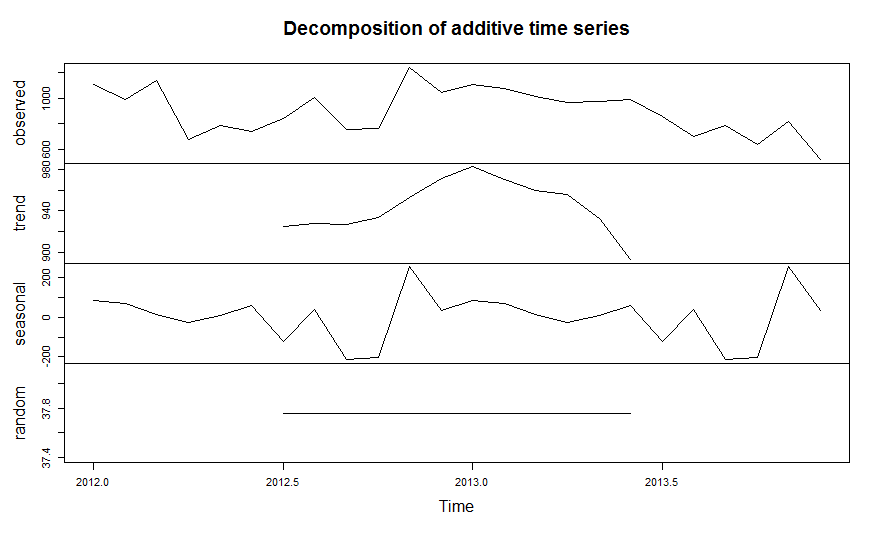
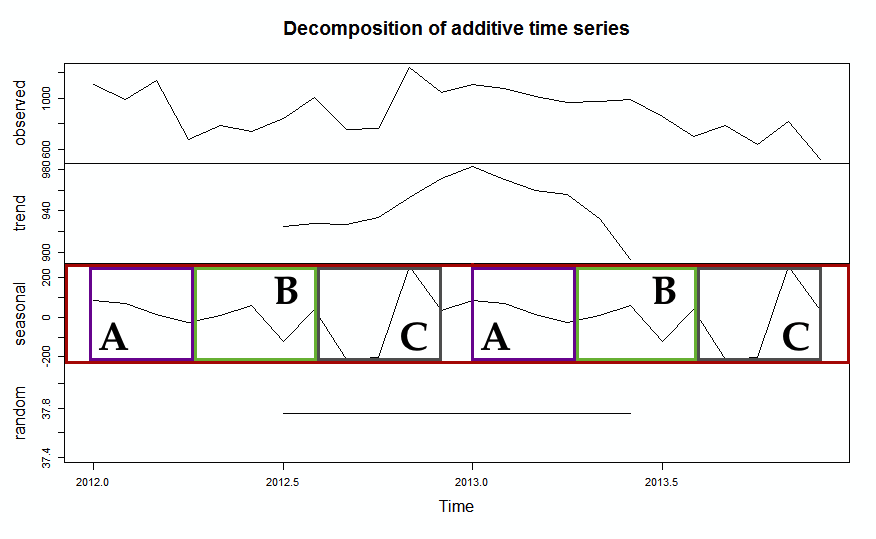
I'm new to this and I have a question about the results that I get from checking whether my data contains seasonality or not. I have a csv file which contains date, period and year. However, R reads the date as a factor and I didn't know how to deal with is. So I extracted the frequencies per month, so I have very little points now. The point contain the frequencies of the years 2012 and 2013.
My code:
k <- c(1110,989,1141,674,790,739,842,1004,751,765,1246,1045,
       1106,1078,1012,965,978,991,856,703,784,639,821,518)

z <- ts(k, start =c(2012,1), frequency =12)

plot(decompose(z))

I really don't know how to read this an whether I can draw a conclusion about seasonality by this methods or not.

