57
$\begingroup$

Is Average Precision (AP) the Area under Precision-Recall Curve (AUC of PR-curve) ?

EDIT:

here is some comment about difference in PR AUC and AP.

The AUC is obtained by trapezoidal interpolation of the precision. An alternative and usually almost equivalent metric is the Average Precision (AP), returned as info.ap. This is the average of the precision obtained every time a new positive sample is recalled. It is the same as the AUC if precision is interpolated by constant segments and is the definition used by TREC most often.

http://www.vlfeat.org/overview/plots-rank.html

Moreover, the auc and the average_precision_score results are not the same in scikit-learn. This is strange, because in the documentation we have:

Compute average precision (AP) from prediction scores This score corresponds to the area under the precision-recall curve.

here is the code:

# Compute Precision-Recall and plot curve
precision, recall, thresholds = precision_recall_curve(y_test, clf.predict_proba(X_test)[:,1])
area = auc(recall, precision)
print "Area Under PR Curve(AP): %0.2f" % area  #should be same as AP?

print 'AP', average_precision_score(y_test, y_pred, average='weighted')
print 'AP', average_precision_score(y_test, y_pred, average='macro')
print 'AP', average_precision_score(y_test, y_pred, average='micro')
print 'AP', average_precision_score(y_test, y_pred, average='samples')

for my classifer I have something like:

Area Under PR Curve(AP): 0.65
AP 0.676101781304
AP 0.676101781304
AP 0.676101781304
AP 0.676101781304
$\endgroup$

2 Answers 2

35
$\begingroup$

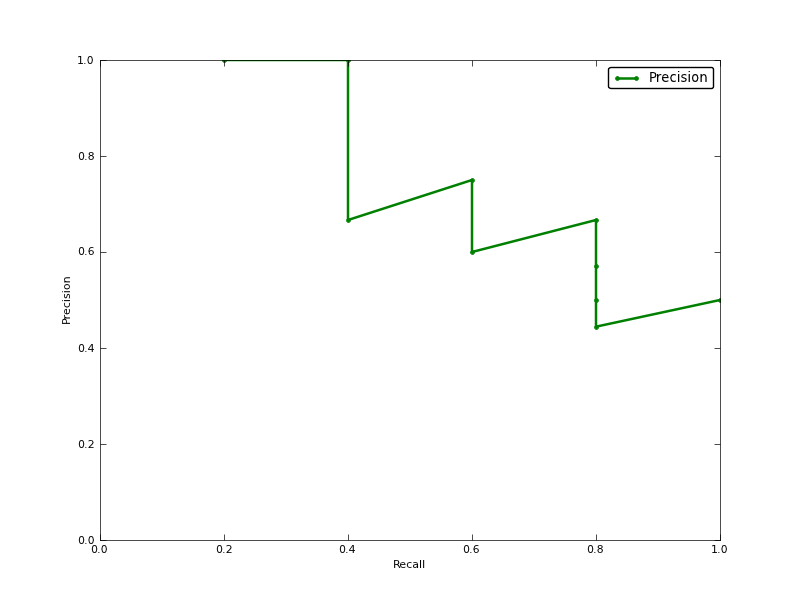
Short answer is: YES. Average Precision is a single number used to summarise a Precision-Recall curve:

enter image description here

You can approximate the integral (area under the curve) with:

enter image description here

Please take a look at this link for a good explanation.

$\endgroup$
5
  • $\begingroup$ What about this comment? "The AUC is obtained by trapezoidal interpolation of the precision. An alternative and usually almost equivalent metric is the Average Precision (AP), returned as info.ap. This is the average of the precision obtained every time a new positive sample is recalled. It is the same as the AUC if precision is interpolated by constant segments and is the definition used by TREC most often." vlfeat.org/overview/plots-rank.html $\endgroup$
    – mrgloom
    Commented Jun 15, 2015 at 10:44
  • 2
    $\begingroup$ I think the average of the precision obtained every time a new positive sample is recalled refers to Interpolated average precision explained in the link I gave. Some authors choose an alternate approximation that is called the interpolated average precision. Confusingly, they still call it average precision. $\endgroup$
    – Zhubarb
    Commented Jun 15, 2015 at 10:50
  • $\begingroup$ a few quick questions: 1) why coordinate (recall=0, precision=1)? makes no sense to me at all. 2) as you might observe, if we lower the classifier's threshold, more results could be returned, and as a consequence, recall might not increase, but precision could vary, for example, with 2 positive items in total, here is the ranked results = [False, True, False, False, True], so p-r pairs = [(p=0, r=0), (1/2, 1/2), (1/3, 1/2), (1/4, 1/2), (2/5, 2/2)], as you can see, for r=1/2, there're 3 p (i.e. 1/2, 1/3, 1/4), just like in your graph at r=0.8, it's ok just plot them at the same x axis? $\endgroup$
    – avocado
    Commented Dec 23, 2017 at 9:43
  • 1
    $\begingroup$ @Zhubarb Most of the credible articles mention that the average of the precision obtained every time a new positive sample is recalled is average precision and this is approximated by the area under the uninterpolated precision-recall curve - nlp.stanford.edu/IR-book/html/htmledition/…, engineering.purdue.edu/kak/SignificanceTesting.pdf and wikipedia (en.wikipedia.org/wiki/…). While the article you shared mentions opposite of that. $\endgroup$ Commented Nov 26, 2021 at 19:56
  • $\begingroup$ Maybe worth mentioning for future readers that the AP is not equal to the AUPRC for the scikit learn implementation, from the docs "This implementation is not interpolated and is different from computing the area under the precision-recall curve with the trapezoidal rule, which uses linear interpolation and can be too optimistic." scikit-learn.org/stable/modules/generated/… $\endgroup$
    – Björn
    Commented Mar 15, 2023 at 15:35
4
$\begingroup$

average_precision_score function expect confidence or probability as second parameter.

so you should use it as below,

average_precision_score(y_test, clf.predict_proba(X_test)[:,1])

and then it's same result of auc function.

$\endgroup$
1
  • $\begingroup$ Different examples in WEKA software and scikit-learn provide CLF score but not AUC. Can it be that this CLF score is actually somehow related to AUC or even be AUC? $\endgroup$
    – hhh
    Commented Jul 7, 2017 at 0:00

Your Answer

By clicking “Post Your Answer”, you agree to our terms of service and acknowledge you have read our privacy policy.

Not the answer you're looking for? Browse other questions tagged or ask your own question.