7
$\begingroup$

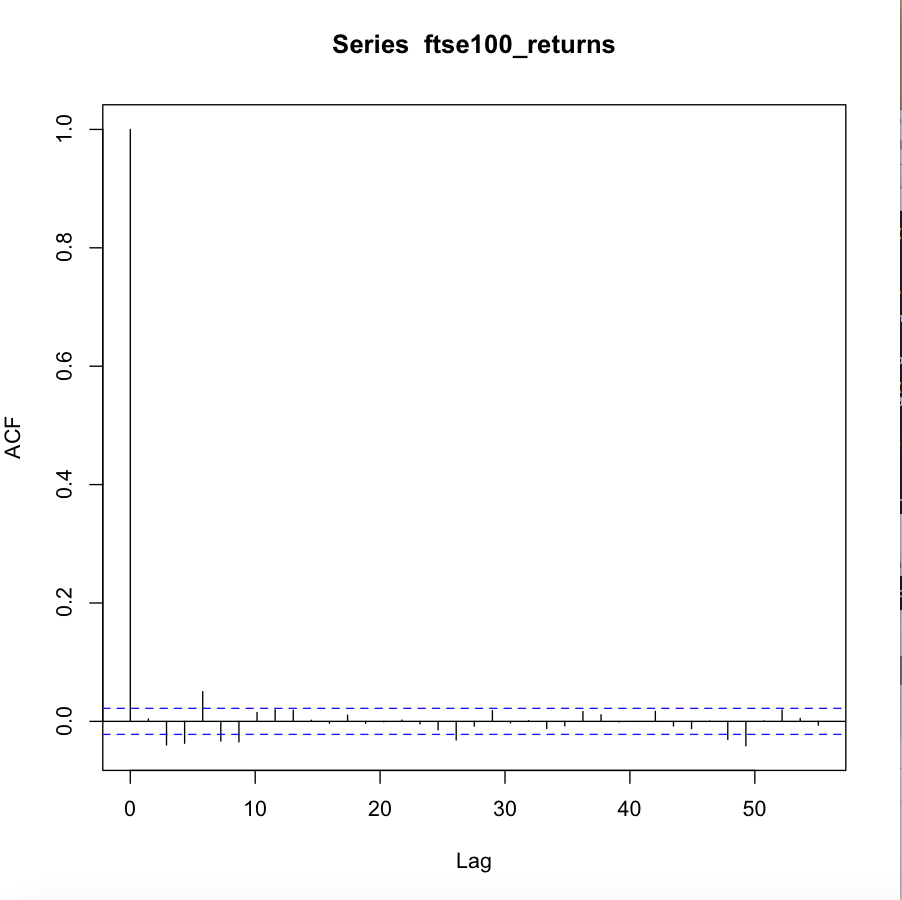
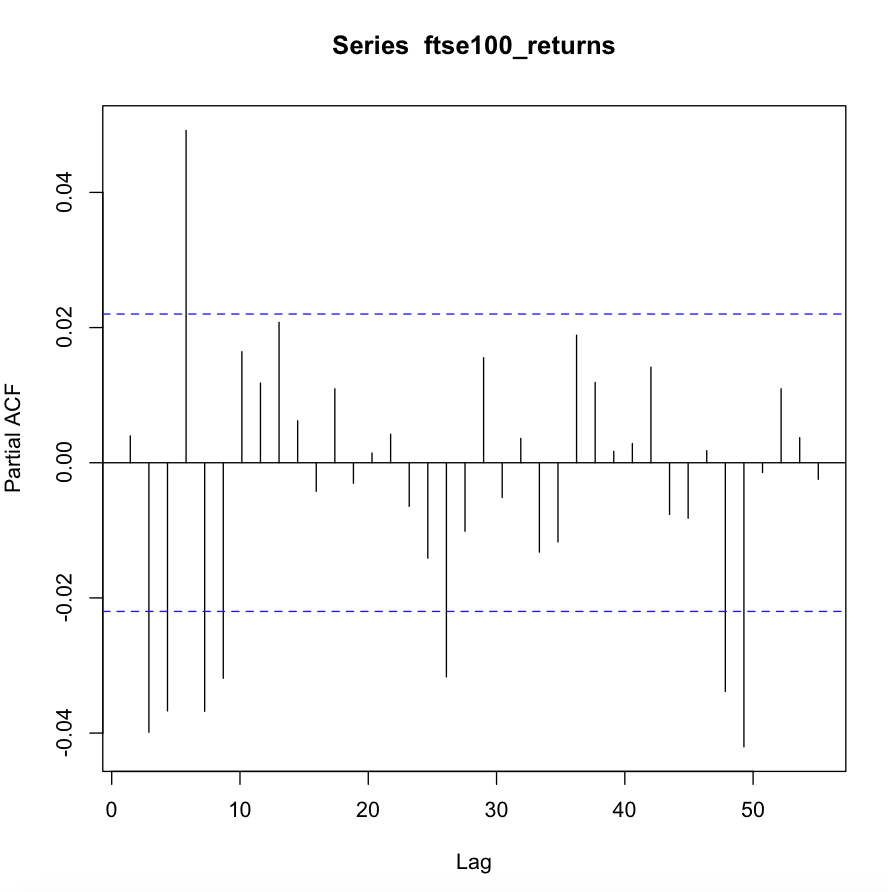
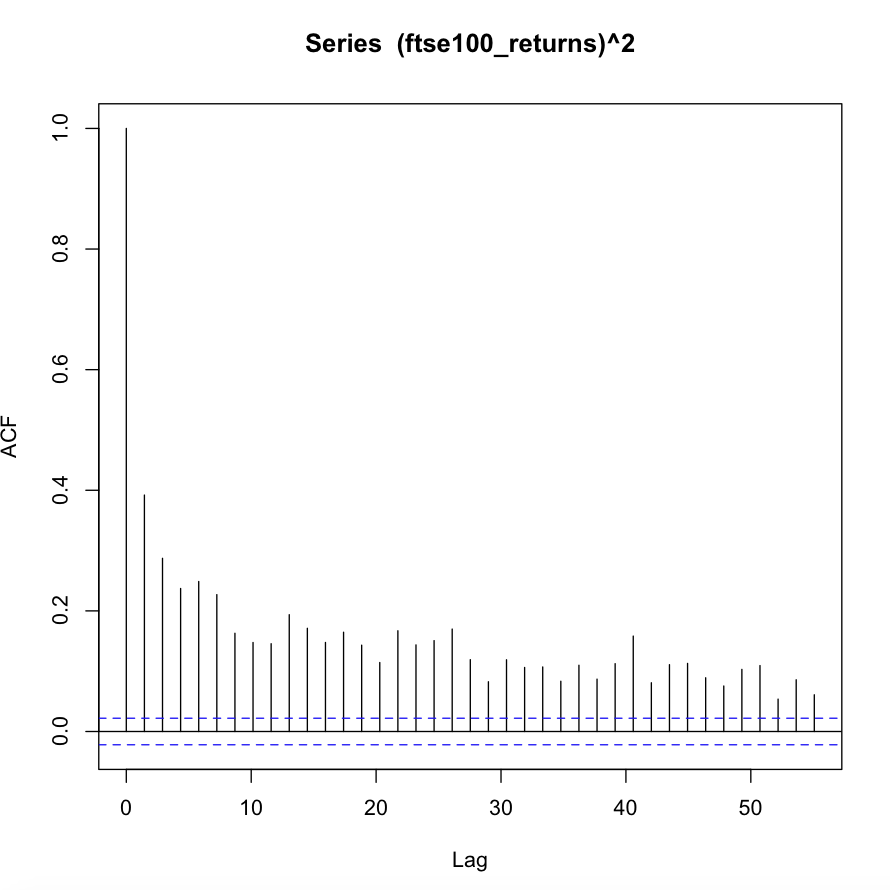
I'm trying to fit an ARMA-GARCH model to a data set of FTSE 100 log returns (which I've uploaded here). However, I'm not able to find a well-fitting model. Below are the ACF and PACF of the log return series and the ACF of the squared log return series. Looking at the ACF of the squared series, there seems to be conditional heteroscedasticity present in the data, making an ARCH or GARCH model appropriate. At the same time there seem to be significant autocorrelations, making an ARMA-type model for the conditional mean appropriate.

Fitting ARMA(p,q)-GARCH(1,1) models of various orders (p,q) and selecting by AIC, I choose p = 1, q =2. However, the model doesn't seem to provide a decent fit as indicated by the following output:

Weighted Ljung-Box Test on Standardized Residuals
------------------------------------
                         statistic p-value
Lag[1]                       3.847 0.04983
Lag[2*(p+q)+(p+q)-1][8]      5.474 0.06272
Lag[4*(p+q)+(p+q)-1][14]    10.146 0.10862
d.o.f=3
H0 : No serial correlation

Weighted Ljung-Box Test on Standardized Squared Residuals
------------------------------------
                        statistic   p-value
Lag[1]                      11.11 0.0008589
Lag[2*(p+q)+(p+q)-1][5]     12.32 0.0022979
Lag[4*(p+q)+(p+q)-1][9]     12.75 0.0121929
d.o.f=2

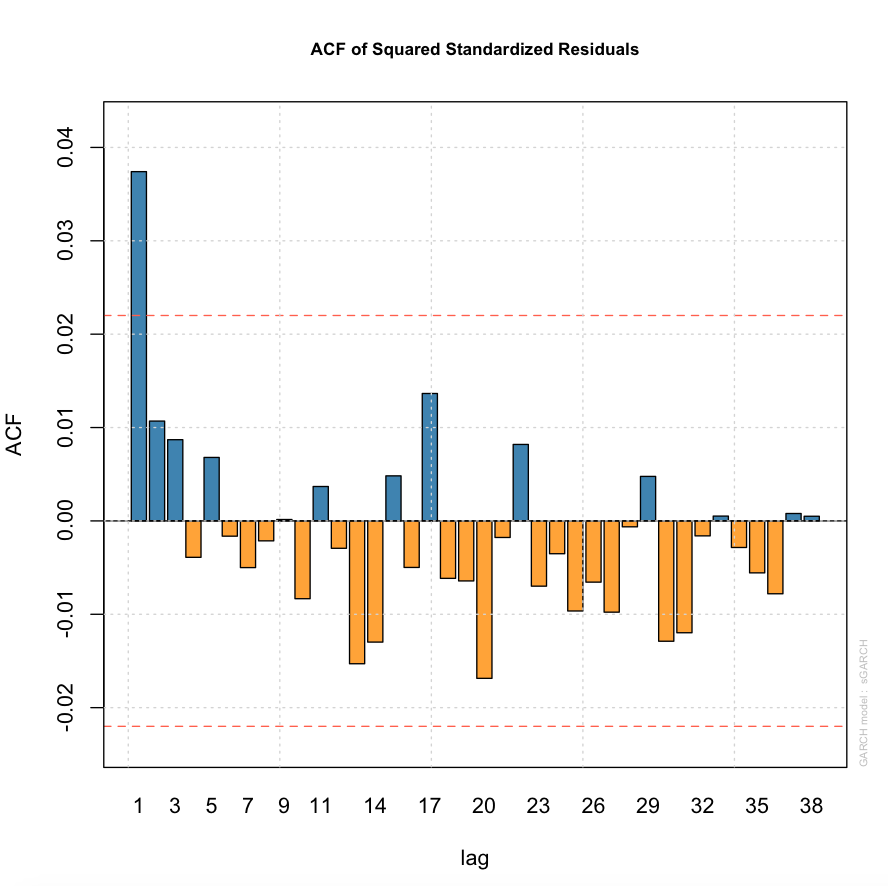
On the other hand, the ACF of the standardised residuals and the squared standardised residuals look okay (see below). My question is whether my model selection mechanism (AIC is in this case) is appropriate for the data set at hand (despite the hypothesis test results given above).
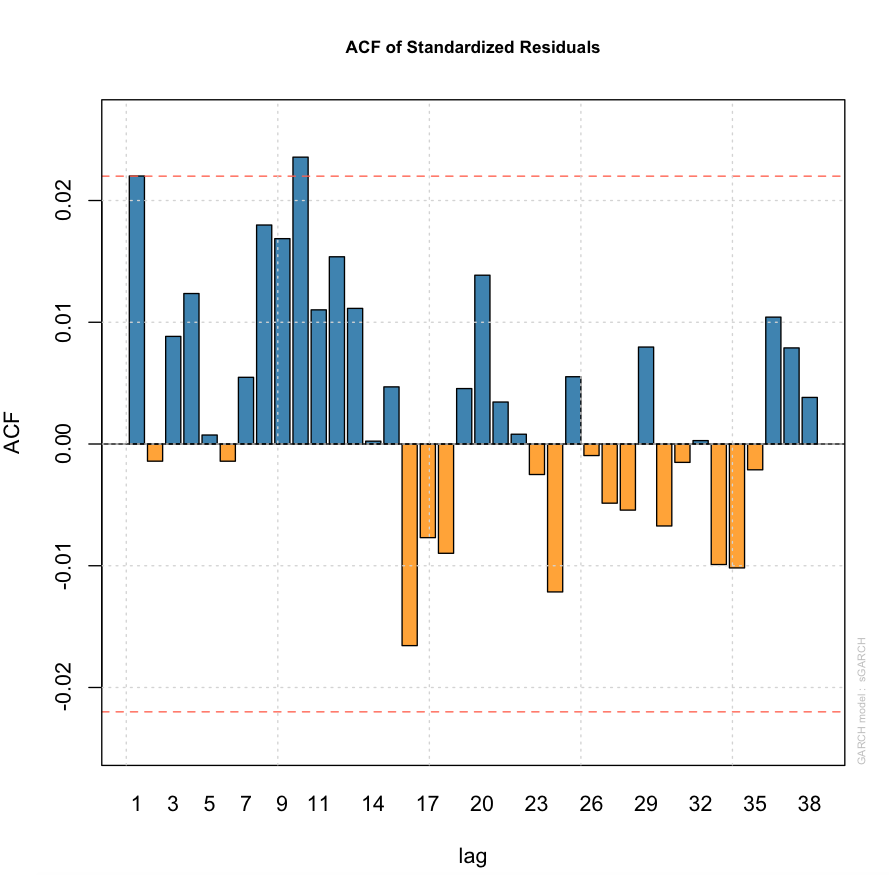
ACF of standardised model residuals

ACF of squared standardised model residuals ACF

PACF

ACF of squared observations

$\endgroup$
3
  • $\begingroup$ Could you post your data or full output? $\endgroup$
    – Plissken
    Commented Jul 5, 2015 at 16:12
  • 3
    $\begingroup$ It is very unlikely to have significant autocorrelation of returns in time series of tradable instruments in a competitive market. You are zooming the graph and the bars look big, but in reality those autocorrelations are very low (i.e. 0.02). Squared returns are a different matter, they exhibit strong autocorrelation. It is a stylized fact called volatility clustering. $\endgroup$ Commented Jul 6, 2015 at 12:26
  • $\begingroup$ I've edited my post to include the log return data. $\endgroup$ Commented Jul 7, 2015 at 8:17

1 Answer 1

2
$\begingroup$

In short, you should select models using AIC and/or out-of-sample fit criteria and view the rejected hypothesis as a suggestion to consider other types of models.

When using this class of time series models researchers are usually interested in accurate prediction\forecasting. Since AIC measures how well a model predicts the data in-sample, it operates as a fair means of model selection in this case (you may also want to test how well the models fit out-of-sample…more on that below).

However, just because a particular model has the lowest AIC does not mean that that model is correctly specified or that it approximates the true data generating process well. It could be that all the models you proposed were poor choices, or that the true process FTSE follows is so complex that practically every reasonable model will be rejected given enough data. AIC provides no information on this point which is where hypothesis testing can come in.

Under the assumptions of standard ARMA-GARCH, the residuals should be homoscedastic and more generally iid normal. Your hypothesis test suggests that your residuals are not homoscedastic and, in turn, that your ARMA-GARCH model may be miss specified. On this note you may want to consider alternative specifications for the volatility process including other variants of GARCH models, i.e. EGARCH, GJR-GARCH, TGARCH, AVGARCH, NGARCH, GARCH-M, etc. and/or stochastic volatility models. It is highly likely that one of these models will offer a lower AIC value and produce residuals which cannot be rejected for homoscedasticity.

One important thing to note though is that no model will be perfect, especially for something like the FTSE 100. The true data generating process driving a large financial index like this is impossibly complex, so pretty much every model you propose will be false. For this reason, it can be argued that any meaningful hypothesis you do not reject is a reflection of insufficient data or lack of statistical power rather than evidence supporting one model over others.

One way to partially resolve this dilemma is to use out-of-sample fit as opposed to or in conjunction with AIC. A simple example would be to fit the model using only the first 80% or 90% of the data and using the resulting coefficient estimates to obtain a log-likelihood for the remaining 20%-10% portion of the data. The model with the highest log-likelihood would be preferred. If the ARMA-GARCH model is truly misspecified in a way that impairs its forecasting performance, then an out-of-sample fit will help expose it.

$\endgroup$
1
  • $\begingroup$ The formulation of AIC measures how well a model predicts the data in-sample is confusing. AIC estimates the model's likelihood of a new observation coming from the same distribution. It does so based on in-sample information, i.e. uses in-sample likelihood and penalizes it for overfitting. To underline, AIC does not measure in-sample fit, it estimates out-of-sample fit (expected likelihood of a new observation). $\endgroup$ Commented Jul 1, 2020 at 7:25

Your Answer

By clicking “Post Your Answer”, you agree to our terms of service and acknowledge you have read our privacy policy.

Not the answer you're looking for? Browse other questions tagged or ask your own question.