10
$\begingroup$

Thinking about a supposedly simple but interesting problem, I'd like to write some code to forecast consumable I'll need in the near future given the full history of my previous purchases. I'm sure this kind of problem has some more generic and well studied definition (someone suggested this is related to some concepts in ERP systems and the like).

The data I have is the full history of previous purchases. Let's say I'm looking at paper supplies, my data looks like (date, sheets):

2007-05-10   500
2007-11-11  1000
2007-12-18  1000
2008-03-25   500
2008-05-28  2000
2008-10-31  1500
2009-03-20  1500
2009-06-30  1000
2009-09-29   500
2009-12-16  1500
2010-05-31   500
2010-06-30   500
2010-09-30  1500
2011-05-31  1000

it's not 'sampled' at regular intervals, so I think it doesn't qualify as a Time Series data.

I have no data on the actual stock levels every time. I'd like to use this simple and limited data to predict how much paper I'll need in (for example) 3,6,12 months.

So far I came to know that what I'm looking for is called Extrapolation and not much more :)

What algorithm could be used in such a situation?

And what algorithm, if different from the previous one, could also take advantage of some more data points giving the current supply levels (e.g., if I know that on date X I had Y sheets of paper left)?

Please feel free to edit the question, title and tags if you know a better terminology for this.

EDIT: for what it's worth, I will be trying to code this in python. I know there are lots of libraries that implement more or less any algorithm out there. In this question I'd like to explore the concepts and the techniques that could be used, with the actual implementation to be left as an exercise to the reader.

$\endgroup$
1
  • 1
    $\begingroup$ dear statisticians, I just want to let you know this question has not been abandoned. I will get back to this specific problem as soon as I find time and motivation (read: boss tells me to do this) and will investigate your precious answers and eventually mark one as accepted (which for me will mean "actually implemented"). $\endgroup$
    – Luke404
    Commented Sep 11, 2013 at 18:13

8 Answers 8

12
$\begingroup$

The question concerns the rate of consumption versus time. This calls for regression of the rate against time (not regression of total purchases against time). Extrapolation is accomplished by constructing prediction limits for future purchases.

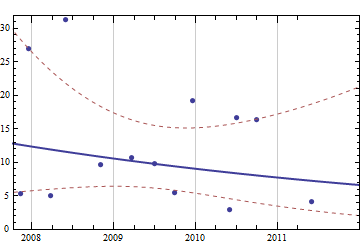
Several models are possible. Given the move to a paperless office (which has been ongoing for about 25 years :-), we might adopt an exponential (decrease) model. The result is portrayed by the following scatterplot of the consumption, on which are drawn the exponential curve (fitted via ordinary least squares to the logarithms of the consumption) and its 95% prediction limits. Extrapolated values would be expected to lie near the line and between the prediction limits with 95% confidence.

Figure

The vertical axis shows pages per day on a linear scale. The dark blue solid line is the fit: it is truly exponential but comes remarkably close to being linear. The effect of the exponential fit appears in the prediction bands, which on this linear scale are asymmetrically placed around the fit; on a log scale, they would be symmetric.

A more precise model would account for the fact that consumption information is more uncertain over shorter periods of time (or when total purchases are smaller), which could be fitted using weighted least squares. Given the variability in these data and the rough equality of the size of all purchases, it's not worth the extra effort.

This approach accommodates intermediate inventory data, which can be used to interpolate consumption rates at intermediate times. In such a case, because the intermediate amounts of consumption could vary considerably, the weighted least squares approach would be advisable.

What weights to use? We might consider the paper consumption, which necessarily accrues in integral amounts of paper, as a count which varies independently from day to day. Over short periods, the variance of the count would therefore be proportional to the length of the period. The variance of the count per day would then be inversely proportional to the length of the period. Consequently the weights should be directly proportional proportional to the periods elapsed between inventories. Thus, for example, the consumption of 1000 sheets between 2007-05-10 and 2007-11-11 (about 180 days) would have almost five times the weight of the 1000 sheet consumption between 2007-11-11 and 2007-12-18, a period of only 37 days.

The same weighting can be accommodated in the prediction intervals. This would result in relatively wide intervals for predictions of consumption during one day compared to prediction for consumption over, say, three months.

Please note that these suggestions focus on simple models and simple predictions, appropriate for the intended application and the obvious large variability in the data. If the projections involved, say, defense spending for a large country, we would want to accommodate many more explanatory variables, account for temporal correlation, and provide much more detailed information in the model.

$\endgroup$
7
  • $\begingroup$ had the data been sampled at regular intervals, would using counts as opposed to rates have been appropriate? $\endgroup$
    – MannyG
    Commented Nov 16, 2011 at 13:52
  • 1
    $\begingroup$ @MannyG Yes, but only because the counts would be directly proportional to the rates, not because it would be appropriate to use the counts themselves. The need to use rates here is clear when we consider what it really means to predict a future value: you have to specify the time interval of the predicted consumption. One is thereby predicting an amount times a time to get a quantity, implying that amount must be a quantity per unit time: a consumption rate. $\endgroup$
    – whuber
    Commented Nov 16, 2011 at 14:06
  • $\begingroup$ @whuber Excuse me but I can't clearly understand which models are described in your answer and in which points one ends and starts another. I have a similar problem and parts of your answer seems exactly what I need, but I have to do some more study on this matter and I can't tell by reading your answer if you're talking about distinct models or a certain one that is improved gradually. Is there a formal name for the model with the weights that you're describing? Does your first model (exponential decrease) involves weights? Thanks in advance. $\endgroup$
    – Agis
    Commented Aug 26, 2013 at 12:50
  • $\begingroup$ @rensokuken I describe one model and a variation that weights the data. The second half of this answer suggests how to determine the weights. I do not know of any formal name beyond "weighted least squares." $\endgroup$
    – whuber
    Commented Aug 26, 2013 at 15:10
  • $\begingroup$ @whuber I see. In the beginning you're describing this and then when you add weights you're describing this, right? Also, do you have any resources to look at, related to the particular solution and for a beginner in forecasting? Thanks for the clarification. $\endgroup$
    – Agis
    Commented Aug 27, 2013 at 7:36
6
$\begingroup$

This is definitely the machine learning problem (I updated tags in your post). Most probably, this is linear regression. In short, linear regression tries to recover relationship between 1 dependent and 1 or more independent variables. Dependent variable here is consumables usage. For independent variables I suggest time intervals between purchases. You can also add more independent variables, for example, number of people who used consumables at each moment, or anything else that can affect an amount of purchases. You can find nice description of linear regression together with implementation in Python here.

In theory, it is also possible that not only time intervals between purchases, but also moments in time themselves influence on the amounts. For example, for some reason in January people may want more paper than, say, in April. In this case you cannot use number of month as independent variable itself due to the nature of linear regression itself (number of the month is just a label, but will be used as amount). So you have 2 ways how to overcome this.

First, you can add 12 additional variables, one for each month, and set each variable to 1 if it represents month of purchase and to 0 if it doesn't. Then use same linear regression.

Second, you can use use more sophisticated algorithm, such as M5', which is mix of linear regression and decision trees (you can find detailed description of this algorithm in Data Mining: Practical Machine Learning Tools and Techniques).

$\endgroup$
1
  • $\begingroup$ It depends on how much data about the user you have. If quite enough (say, > 100 transactions over > 1 year), you can train a model for this specific user. Otherwise, general model over all users may give you better results. You can use cross-validation to measure performance of both approaches. $\endgroup$
    – ffriend
    Commented Jan 15, 2017 at 19:49
5
$\begingroup$

it's not 'sampled' at regular intervals, so I think it doesn't qualify as a Time Series data.

Here is an idea about how to forecast the purchases: consider the data as an intermittent demand series. That is, you do have a time series sampled at regular intervals, but the positive values are obviously irregularly spaced. Rob Hyndman has a nice paper on using Croston's method for forecasting intermittent demand series. While I also program a lot in Python, you'll save a lot of exploration time by using Croston's method, as well as other time series forecasting methods, readily available in Rob's excellent R package forecast.

$\endgroup$
1
  • 1
    $\begingroup$ +1 For offering a new idea. Perusing the introduction and conclusions of the Shenstone & Hyndman paper, though, suggests Croston's method is generally not very good: the paper focuses on trying to justify and understand a popular procedure that turns out to be limited; the best the authors can say is that despite this, "forecasts ... may still be useful." Also, it looks like this model couldn't accommodate the additional data on "current supply levels" as requested by the OP. $\endgroup$
    – whuber
    Commented Nov 17, 2011 at 16:01
3
$\begingroup$

I'm pretty sure you are trying to do some regression analysis to fit a line to your data points. There are plenty of tools out there to help you - MS Excel being the most accessable. If you want to roll your own solution, best to brush up on your statistics (here and here, perhaps). Once you fit a line to your data, you can extrapolate into the future.

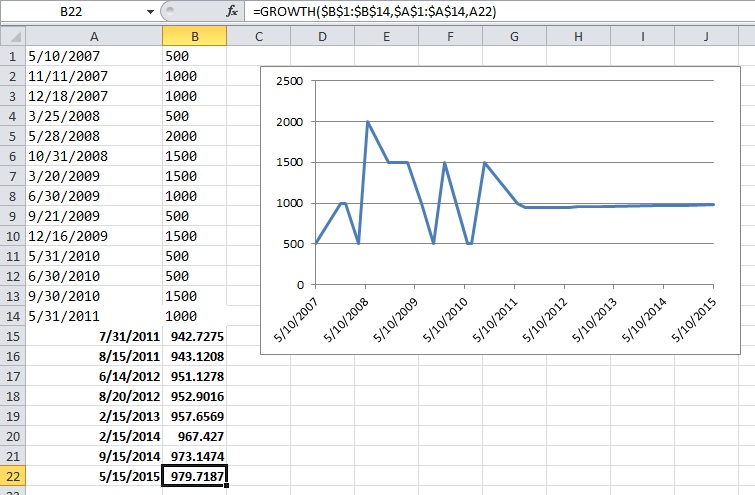
EDIT: Here is a screenshot of the excel example I mentioned in the comments below. The bolded dates are random dates in the future that I typed in myself. The bold values in column B are extrapolated values calculated by Excel's flavor of exponential regression. enter image description here

EDIT2: OK, so to answer the question of, "What techniques can I use?"

  • exponential regression (mentioned above)
  • Holt's Method
  • Winter's method
  • ARIMA

Please see this page for a little intro on each: http://www.decisioncraft.com/dmdirect/forecastingtechnique.htm

$\endgroup$
2
  • $\begingroup$ This led me to ask myself: what are my data points? not the single purchases - that wouldn't take into account how much time passes between them and thus the total consumption of a given resource. Maybe I should interpolate them to get some average at regular intervals (e.g., quantity per week) and then use that as a time series data input to extrapolate future data? $\endgroup$
    – Luke404
    Commented Nov 14, 2011 at 22:39
  • $\begingroup$ Think of the difference in time as the difference in your 'x' values on a plot. Most types of regression analysis will take into account the varied differences. Try your sample data using the GROWTH function in Excel, which uses exponential regression. If you change the dates, your projected values will change accordingly. $\endgroup$
    – eterps
    Commented Nov 14, 2011 at 22:57
3
$\begingroup$

Started as a comment, grew too long...

it's not 'sampled' at regular intervals, so I think it doesn't qualify as a Time Series data

This is an erroneous conclusion - it's certainly time series. A time series may be irregularly sampled, it just tends to require different from the usual approaches when it is.

This problem appears to be related to stochastic problems like dam levels (water is generally used at a fairly stable rate over time, sometimes increasing or decreasing more or less quickly, while at other times its fairly stable), while dam levels tend to only increase rapidly (essentially in jumps), as rainfall occurs. The paper usage and replenishment patterns may be somewhat similar (though the amount ordered may tend to be much more stable and in much rounder numbers than rainfall amounts, and to occur whenever the level gets low).

It's also related to insurance company capital (but kind of reversed) - aside initial capital, money from premiums (net operating costs) and investments comes in fairly steadily (sometimes more or less), while insurance policy payments tend to be made in relatively large amounts.

Both of those things have been modelled, and may provide a little insight for this problem.

$\endgroup$
-1
$\begingroup$

you should have a look at WEKA. It is a tool and a Java API with a suite of machine learning algorithms. In particular you should look for classification algorithms.

Good luck

$\endgroup$
2
  • $\begingroup$ How would a classification algorithm give me a quantitative prediction? $\endgroup$
    – Luke404
    Commented Nov 14, 2011 at 22:26
  • $\begingroup$ @Luke404: Weka has 3 types of algorithms (classification, clustering and association mining), and they decided to put regression into classification section. But in general you are right, classification and quantitative prediction are a bit different things. $\endgroup$
    – ffriend
    Commented Nov 14, 2011 at 23:55
-1
$\begingroup$

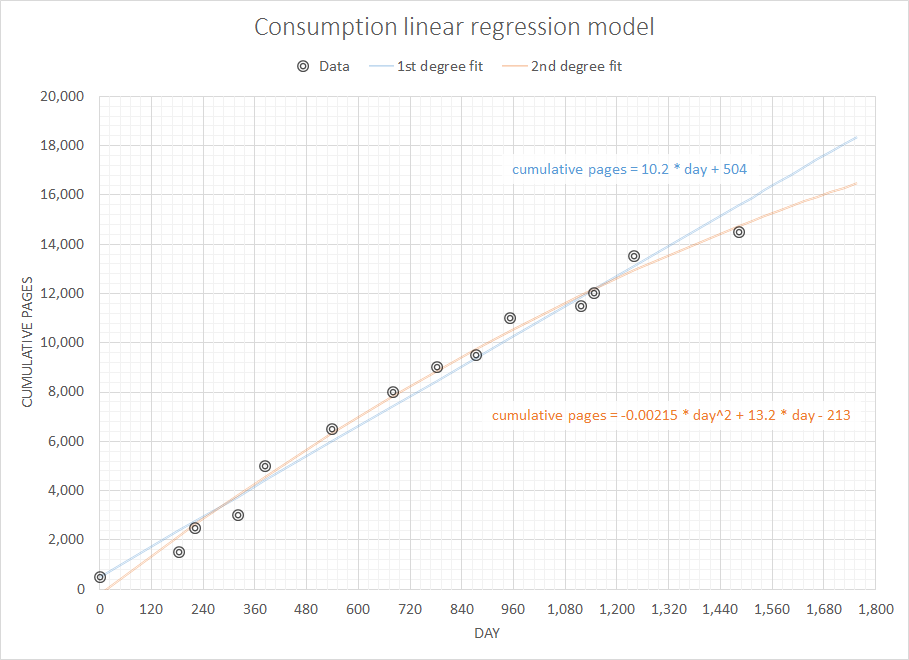
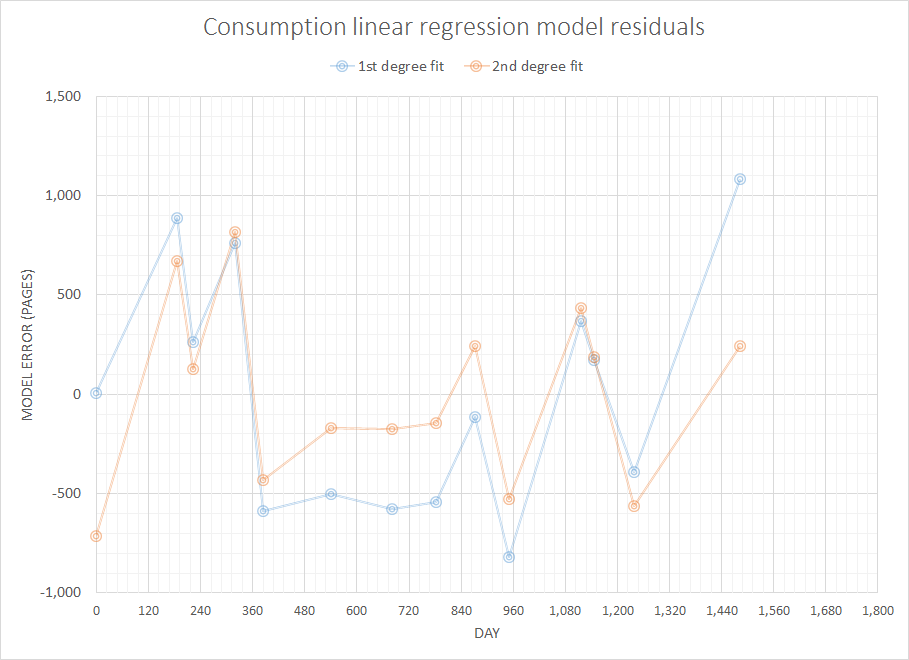
I would use linear least squares to fit a model to the cumulative consumption (i.e. running total of pages by date). An initial assumption would be to use a first degree polynomial. However the residuals indicate that the first degree is underfitting the data in the example, so the next logical step would be to increase it to a second degree (i.e. quadratic) fit. This removes the curvature in the residuals, and the slightly negative coefficient for the squared term means that the consumption rate is decreasing over time, which seems intuitive given that most people probably tend to use less paper over time. For this data I don't think you need to go beyond a second degree fit, as you may start overfitting and the resulting extrapolation may not make sense.

You can see the fits (including extrapolation) and the residuals in the plots below.

fit residual

If you can, it might be good to perform bootstrapping to get a better estimate of the prediction errors.

$\endgroup$
1
  • $\begingroup$ Because the residuals in the cumulative consumption would be strongly correlated, this method does not appear statistically justified. Using a quadratic fit only papers over this fundamental problem; it cannot cure it. $\endgroup$
    – whuber
    Commented Jun 5, 2013 at 15:11
-2
$\begingroup$

I think you can get your data using operations research.

Why don't you try to find some equations that takes as variables the amount of paper used per time period, users of the paper, etc?

$\endgroup$

Not the answer you're looking for? Browse other questions tagged or ask your own question.