1
$\begingroup$

Note: I am not a stats expert.

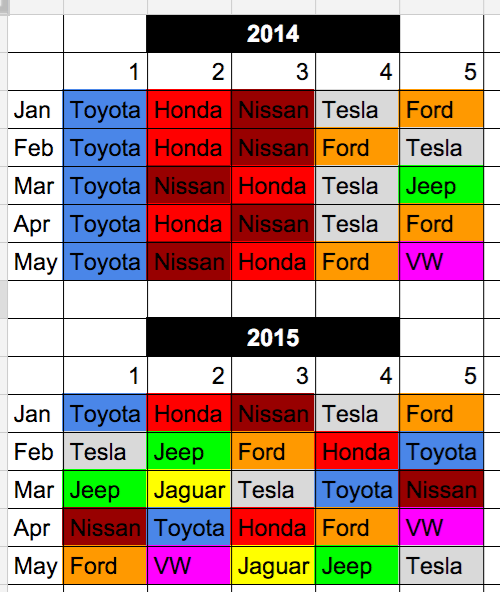
I have the following hypothetical example: The image below describes the five highest sold car brands (monthly) in 2014 versus in 2015 (only 5 months).

Top 5 brands in 2014 vs 2015

In 2014, the market was relatively "stable". A few changes happened in the top 5 rankings of brands. And only 2 new brands (Jeep and VW) made it to the top 5 list.

In 2015, the ranking of brands was constantly changing from month to month and new brands jumped to the top and disrupted the market. The market was very "dynamic".

I want to have a mathematical metric that describes how dynamic/stable a market is, where 0.0 is highest stable (stagnant) and 1.0 is very dynamic. In my example: the 2014 market will be around 0.2 while the 2015 market will be around 0.8.

By "dynamic", I mean "the ranking is aggressively changing from month to month and new brands disrupt the dominance of previous top brands".

Is there such a metric? if not, any suggestions for a formula?

Thank you!

$\endgroup$
4
  • $\begingroup$ Do you have the actual underlying data, or just the top 5 ranking? $\endgroup$ Commented Dec 23, 2015 at 2:32
  • $\begingroup$ Yes, I do have the whole market data. $\endgroup$
    – CS student
    Commented Dec 23, 2015 at 2:52
  • $\begingroup$ What kind of data are they, counts of cars sold? $\endgroup$ Commented Dec 23, 2015 at 2:56
  • $\begingroup$ Yes. Number of cars sold per brand. $\endgroup$
    – CS student
    Commented Dec 23, 2015 at 3:07

1 Answer 1

1
$\begingroup$

If you compare two consecutive months, you have two rankings of the car brands. Thus, you can calculate the Kendall tau distance betwen the rankings (if you want the distance to be in the unit interval, you will need to normalize by the maximum possible distance).

Do this between all consecutive pairs of months, and you will get a time series of these distances. Then you can start looking at things like "the distance in 2015 was consistently higher than in 2014" or "there is an upward trend" (corresponding to increasing dynamics in the market).

This SO post may be helpful if you want to implement this in R: Kendall tau distance (a.k.a bubble-sort distance) between permutations in base R. In addition, this Math.SE post gives you the average distance you would expect, as a kind of a benchmark: https://math.stackexchange.com/questions/1842062/how-to-find-the-average-kendalls-distance-between-2-rankings.

You will need to think of something to deal with new market entrants, and/or brands exiting the market, but that should be doable, e.g., by simply setting them to a rank $N+1$ and dealing with ties in ranks from multiple not-yet-entered brands.

$\endgroup$

Your Answer

By clicking “Post Your Answer”, you agree to our terms of service and acknowledge you have read our privacy policy.

Not the answer you're looking for? Browse other questions tagged or ask your own question.