Note: I am not a stats expert.
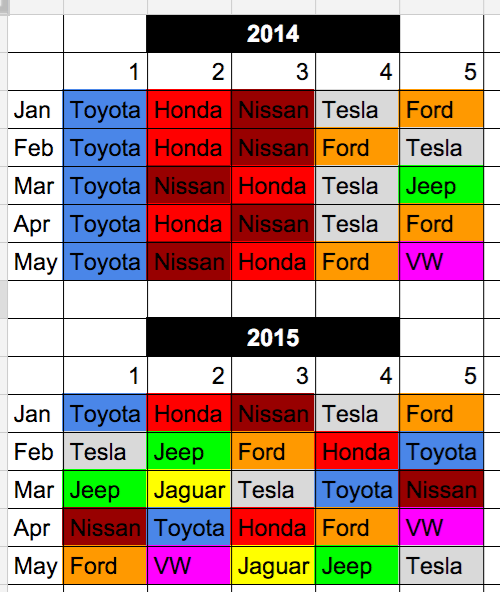
I have the following hypothetical example: The image below describes the five highest sold car brands (monthly) in 2014 versus in 2015 (only 5 months).
In 2014, the market was relatively "stable". A few changes happened in the top 5 rankings of brands. And only 2 new brands (Jeep and VW) made it to the top 5 list.
In 2015, the ranking of brands was constantly changing from month to month and new brands jumped to the top and disrupted the market. The market was very "dynamic".
I want to have a mathematical metric that describes how dynamic/stable a market is, where 0.0 is highest stable (stagnant) and 1.0 is very dynamic. In my example: the 2014 market will be around 0.2 while the 2015 market will be around 0.8.
By "dynamic", I mean "the ranking is aggressively changing from month to month and new brands disrupt the dominance of previous top brands".
Is there such a metric? if not, any suggestions for a formula?
Thank you!

