1
$\begingroup$

I find this counter-intuitive. First I chose randomly 7000 instances and my model explains 55% of the variance. Then I train with the whole dataset (43000) and I get negative $R^2$.

How is this even possible?

This happens with Lasso, elasticnet, ridge regression and SVR with different kernels.

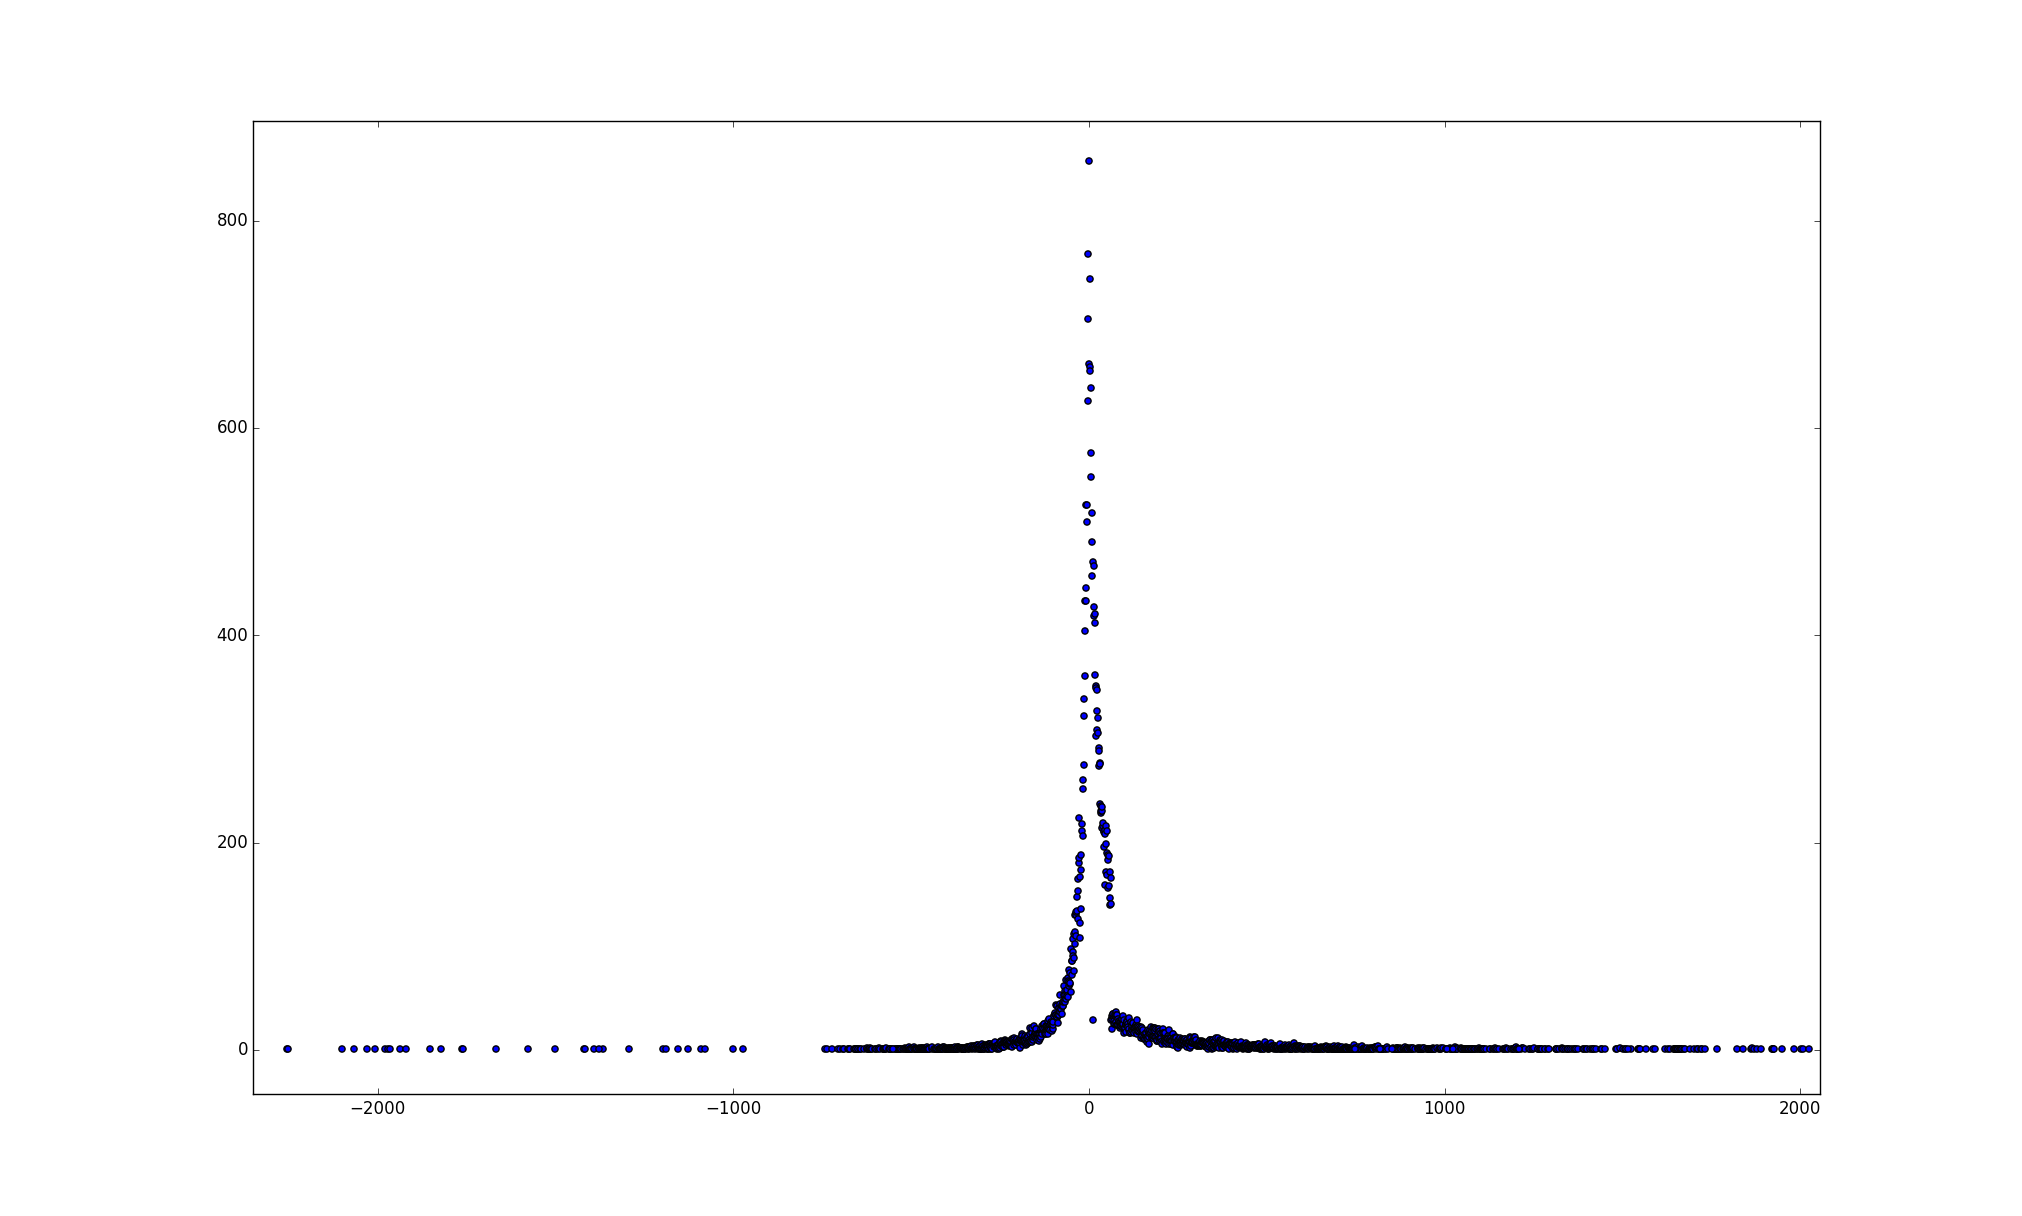
Just for the record, this is how my Y is distributed: enter image description here

$\endgroup$
2
  • 2
    $\begingroup$ Negative $R^2$? Please show such results. $\endgroup$
    – Nick Cox
    Commented Dec 24, 2015 at 11:36
  • $\begingroup$ How many regressors do you have? Did you try multiple samples? $\endgroup$ Commented Dec 24, 2015 at 16:46

1 Answer 1

4
$\begingroup$

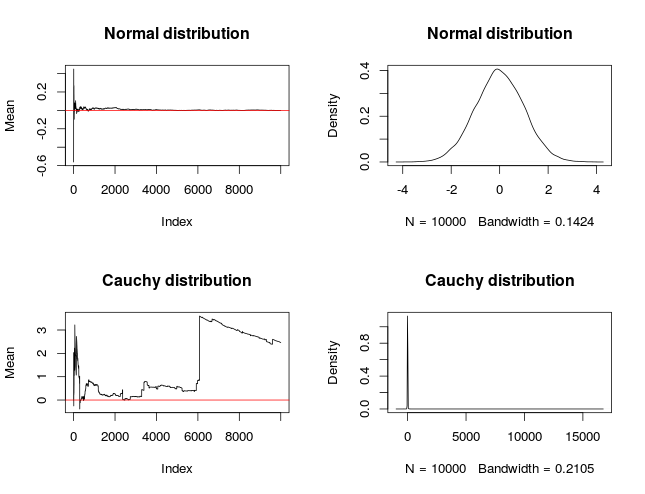
Your question can be answered without referring to regression, based on simpler example of calculating sample mean. In my example I would use two random variables: $X$ that follows normal distribution and $Y$ that follows Cauchy distribution. I am not suggesting here that your $Y$ is Cauchy distributed (it looks similar), but I am using it just as an example. You can recall that Cauchy distribution is a strange kind of distribution that does not follow Central Limit Theorem, has very heavy tails, has no mean and no variance. The plots below show how does mean change with subsequent draws from the distributions (left side) and densities of the distributions after the total $n$ values are drawn, on the top plots you see normal distribution and on the bottom Cauchy. As you can see, when we draw more and more samples from normal distribution, then sample mean converges to population mean. On another hand, Cauchy behaves differently.
enter image description here

You can find nice description here on why Cauchy has no mean, but basically what happens here is that $Y$ has long tails so with drawing additional values you often draw extreme values and such values influence the mean. If you look again at the plots, you'll see that by pure coincidence we were drawing only values from the extreme positive side of the distribution (it is symmetric), so if we drawn more values and after drawing some number of cases, if we observed value $-15000$ it would obviously impact mean no matter that we already sampled $10000$ cases.

> mean(y)
[1] 2.464524
> mean(c(y,-15000))
[1] 0.9644279

With such heavy-tailed variable no matter what regression approach you'll use, you would be focused on the central value of the distribution (mean, median etc.) and you won't be able to make precise estimates for the extreme cases. You can use other approach, e.g. L1 or quantile regression, that would provide more robust estimates of central value, but you should ask yourself it is something that you really want to do.

$\endgroup$
4
  • $\begingroup$ Are you talking about the marginal or conditional distribution of Y? And do you know of any articles that describe this phenomenon? $\endgroup$ Commented Dec 24, 2015 at 12:20
  • 3
    $\begingroup$ @ssdecontrol the question is pretty vague and refers only to marginal distribution, that is why I focus on estimating mean, since no information is provided about conditional distribution. I mention outliers influencing regression as a general phenomenon. I also would be interested in papers on such cases. $\endgroup$
    – Tim
    Commented Dec 24, 2015 at 12:27
  • $\begingroup$ +1 Congratulations on reaching 10K, Tim. Your steady contributions over time have been an asset to this site. $\endgroup$
    – whuber
    Commented Dec 24, 2015 at 16:08
  • $\begingroup$ Thanks a lot. Now, I am running tests with a dataset of 1335 samples with randomly chosen train and test sets each time. I get really different r2 scores (0.336, 0.896, 0.183, -1.92). This is my Y: count 13335.000000 mean 38.889989 std 2106.163136 min -193676.000000 25% -11.000000 50% 21.000000 75% 62.000000 max 20505.000000 $\endgroup$ Commented Dec 28, 2015 at 9:18

Your Answer

By clicking “Post Your Answer”, you agree to our terms of service and acknowledge you have read our privacy policy.

Not the answer you're looking for? Browse other questions tagged or ask your own question.