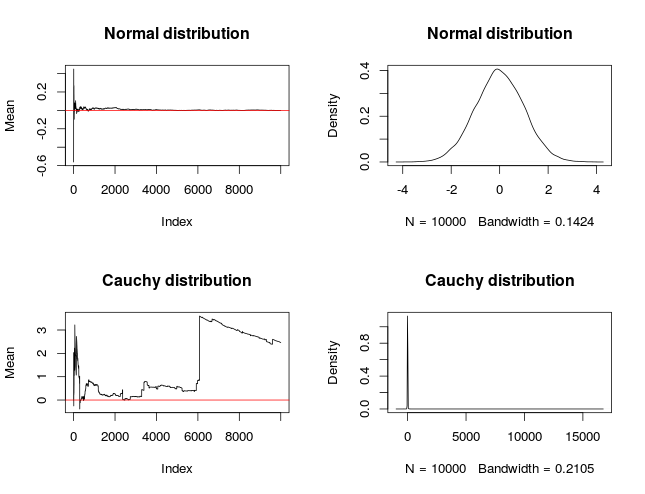
Your question can be answered without referring to regression, based on simpler example of calculating sample mean. In my example I would use two random variables: $X$ that follows normal distribution and $Y$ that follows Cauchy distribution. I am not suggesting here that your $Y$ is Cauchy distributed (it looks similar), but I am using it just as an example. You can recall that Cauchy distribution is a strange kind of distribution that does not follow Central Limit Theorem, has very heavy tails, has no mean and no variance. The plots below show how does mean change with subsequent draws from the distributions (left side) and densities of the distributions after the total $n$ values are drawn, on the top plots you see normal distribution and on the bottom Cauchy. As you can see, when we draw more and more samples from normal distribution, then sample mean converges to population mean. On another hand, Cauchy behaves differently.

You can find nice description here on why Cauchy has no mean, but basically what happens here is that $Y$ has long tails so with drawing additional values you often draw extreme values and such values influence the mean. If you look again at the plots, you'll see that by pure coincidence we were drawing only values from the extreme positive side of the distribution (it is symmetric), so if we drawn more values and after drawing some number of cases, if we observed value $-15000$ it would obviously impact mean no matter that we already sampled $10000$ cases.
> mean(y)
[1] 2.464524
> mean(c(y,-15000))
[1] 0.9644279
With such heavy-tailed variable no matter what regression approach you'll use, you would be focused on the central value of the distribution (mean, median etc.) and you won't be able to make precise estimates for the extreme cases. You can use other approach, e.g. L1 or quantile regression, that would provide more robust estimates of central value, but you should ask yourself it is something that you really want to do.


