0
$\begingroup$

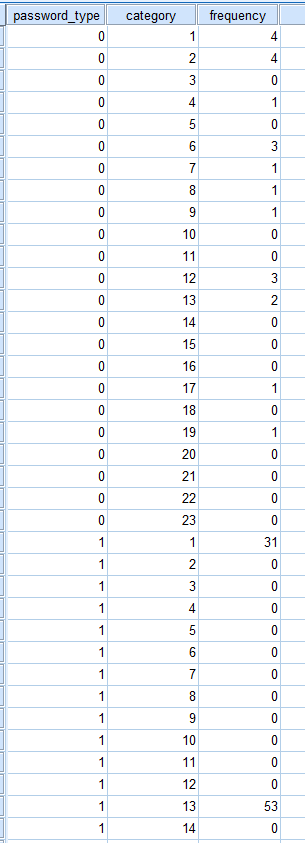
I've been struggling with the following problem and I am not sure if I am using the right statistical method. Namely, I am analyzing passwords characteristics from a questionnaire and from real plane-text passwords. The answers from the questionnaire are categorized in 23 possible categories, regarding the password characteristics and the password composition: from category "1 - numeric - digits only" to category "23 - long sentence, digits and special characters". The plane-text passwords are also categorized in the same categories. My goal is to compare the two variables, the answers from the questionnaire and the plane-text passwords and to see if the answers from the questionnaire are in-line with the real passwords. Note that not all of the categories have a count > 0 (see pictures). Can you, please, tell me what is the right way to compare the answers and tell if there is some statistically significant connection between them?

Thanks for any suggestions.

0 = questionnaire; 1 = plane-text

$\endgroup$
4
  • $\begingroup$ Have you categorized the plain text passwords yourself into the same categories as the questionnaire? Do you have the counts of the frequencies of the different categories? $\endgroup$ Commented Feb 11, 2016 at 14:31
  • $\begingroup$ Yes, I categorised the pale-text passwords into the same categories myself. Here are the frequencies: plain-text questionnaire $\endgroup$ Commented Feb 11, 2016 at 19:52
  • $\begingroup$ What is the "password_type" in your figure? I can't quite figure out what the counts are for the 23 categories in the link. $\endgroup$ Commented Feb 11, 2016 at 20:00
  • $\begingroup$ If you take a look at the first figure where it says "password_type=plain-text" those are the counts for the categories where the plain-text passwords are categorized (the zeros in the big picture). The counts are in column "frequencies", the categories are in the first column. $\endgroup$ Commented Feb 11, 2016 at 20:21

1 Answer 1

0
$\begingroup$

If you want to compare sets of counts for different categories as a function of a grouping variable, you can do so with a chi-squared test. I don't have access to SPSS, but I can demonstrate the basic procedure in R.

(For what it's worth, I can't fathom your data. Let's assume your data are like this:)

tab = read.table(text="     4       31
        4        0
        0        0
        1        0
        0        0
        3        0
        1        0
        1        0
        1        0
        0        0
        0        0
        3        0
        2       53
        0        0
        0        0
        0        0
        1        0
        0        0
        1        0
        0        0
        0        0
        0        0
        0        0", header=FALSE)
tab                  = as.table(as.matrix(tab))
names(dimnames(tab)) = c("category", "password_type")
rownames(tab)        = 1:23
colnames(tab)        = c("questionnaire", "plain.text")
tab                  = tab[which(apply(tab, 1, sum)!=0),]
tab
#         password_type
# category questionnaire plain.text
#       1              4         31
#       2              4          0
#       4              1          0
#       6              3          0
#       7              1          0
#       8              1          0
#       9              1          0
#       12             3          0
#       13             2         53
#       17             1          0
#       19             1          0

Because you have many expected values <1, you cannot trust that the distribution of the test statistic will be well approximated by a chi-squared distribution. Therefore, you should simulate the sampling distribution, or perhaps use a permutation test.

chisq.test(tab, simulate.p.value=TRUE)
#  Pearson's Chi-squared test with simulated p-value (based on 2000
#   replicates)
# 
# data:  tab
# X-squared = 72.741, df = NA, p-value = 0.0004998
$\endgroup$
4
  • $\begingroup$ I performed a chi-square test in SPSS. I have my data organized like this: chi-square. But the results say that the connection is significant, regarding the "obvious" differences in the frequencies for both questionnaire and plain-text. Or am I interpreting this wrong? How can I simulate the sampling distribution in SPSS? $\endgroup$ Commented Feb 12, 2016 at 7:35
  • $\begingroup$ I have no idea how you do it in SPSS. I don't have SPSS (& software questions are generally off topic here). If I have the data right above, you can just use the result in my answer, though. $\endgroup$ Commented Feb 12, 2016 at 12:53
  • $\begingroup$ Thanks a lot. This helps. I've been doing chi-square but since the results are significant and there is a connection between the two variables (frequencies), I wondered whether it is legit, since the obvious differences in the frequencies. Thanks again. $\endgroup$ Commented Feb 12, 2016 at 13:14
  • $\begingroup$ You're welcome, @ViktorTaneski. $\endgroup$ Commented Feb 12, 2016 at 13:32

Your Answer

By clicking “Post Your Answer”, you agree to our terms of service and acknowledge you have read our privacy policy.

Not the answer you're looking for? Browse other questions tagged or ask your own question.