3
$\begingroup$

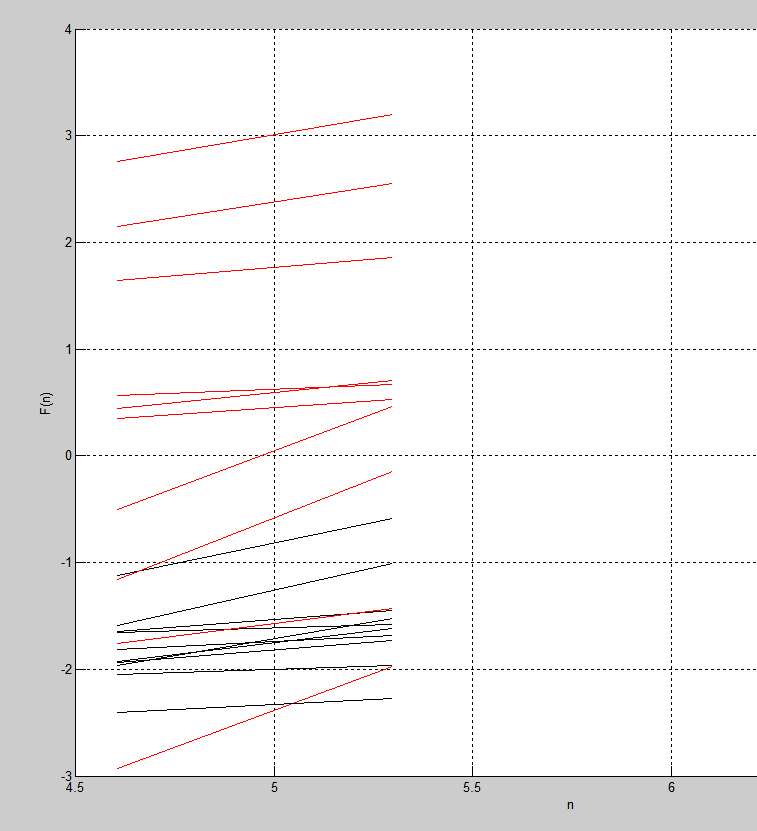
I have done some initial analyses on some patient datasets regarding neuro-degenerative diseases. A method I've used is DFA (Detrended Fluctuation Analysis) in MATLAB, which produced a family of curves (straight lines, in fact) for each patient-disease group. Below is a a sample screenshot:

The red lines demonstrate patients with some disease A while the black lines demonstrate healthy persons. Each line corresponds to a person.

Now, all I want to do is to produce an average curve from each family of curves, in order to demonstrate some general differences between these patient groups. What is the way to do that?

EDIT: I'm editing my question in order to provide some more information about the nature of the datasets I'm working with. The case is the following:

  • I have a total of four groups of subjects. Each group defines a different disease. The last one includes healthy people and acts as a control group.
  • I'm currently studying the stride interval of these people which exists as a time-series. This means that the measurements are not regular. In fact, only in healthy people the measurements seem to have some form of regularity.
  • In the sample screenshot only two groups are shown. The black lines represent healthy individuals, while the red lines patients of a specific group.
  • All I want to do is to produce a mean "curve" for each group, in order to identify some patterns for each disease and compare them.

Below is a subsample of the time-series regarding one single patient:

 #time      #event duration
22.3200         1.2833
23.6433         1.3233
24.9467         1.3033
26.3633         1.4167
27.6000         1.2367
28.9367         1.3367
30.1433         1.2067
31.3400         1.1967
32.5467         1.2067
33.8100         1.2633
34.9800         1.1700
36.1933         1.2133

--

$\endgroup$
11
  • 2
    $\begingroup$ You should probably use a mixed-effects model from the start. $\endgroup$ Commented Feb 12, 2016 at 18:30
  • $\begingroup$ @gung, possibly multi-level model $\endgroup$
    – Aksakal
    Commented Feb 12, 2016 at 18:33
  • 1
    $\begingroup$ Arkoudinos, do you have only two measurements per subject or it just happens that all your "curves" are straight lines? Also do you have access to the MATLAB Statistics ToolBox and which MATLAB version are you using? (MATLAB really upgraded its Stats capabilities lately.) @Aksakal: I think that is gung's idea too. $\endgroup$
    – usεr11852
    Commented Feb 12, 2016 at 18:35
  • $\begingroup$ @Aksakal, mixed-effects model & multi-level models are ultimately equivalent. They have different terminology, etc., for historical reasons. $\endgroup$ Commented Feb 12, 2016 at 18:37
  • $\begingroup$ @Arkoudinos: In general, try to get a hold of the book "Statistical Methods for the Analysis of Repeated Measurements" by C.S.Davis or a book of similar applied longitudinal analysis scope. I think it will be a very valuable resource for you in this line of work. $\endgroup$
    – usεr11852
    Commented Feb 12, 2016 at 18:45

2 Answers 2

1
$\begingroup$

Based on the additional information you provided I believe that using a linear mixed effects model as briefly suggested by @gung is your best choice. Given you are using MATLAB I believe that the resource found here are your best shot to familiarize yourself with the functionality you need to employ regarding the function fitlme.

Using a linear mixed effects model will take care of the fact that you have irregular sampling intervals and that your sample has a clear clustering (different groups of patients). It will also allow you to naturally estimate group-specific means after you marginalize the individual variations.

Do not treat your grouping as being a random factor. Your grouping is a fixed factor. Your random factor is your subject ID (that is nested within grouping but that's another tale). To get you started, something like this:

LMEmodel = fitlme(myData, 'y ~ 1+ x+ (x|group)'))

would fit a fixed effects intercept and slope as well as a $k$-distinct intercepts and slopes for each of the $k$ groups defined by the the variable group. There as some very nice threads on this forum already on how to define random effects structures; see for example the threads on: R's lmer cheat-sheet and Random effect specification in lmer mixed effect model. Note that these threads are concerned with R but actually both R and MATLAB use Wilkinson notation so in that sense you are covered. MATLAB seems not to use the syntax (1|a/b) which would naturally expand (1|a) and (1|a:b) (: denotes an interaction) because probably it is was not part of the original Wilkson notation but OK, you can write it out yourself.

$\endgroup$
0
$\begingroup$

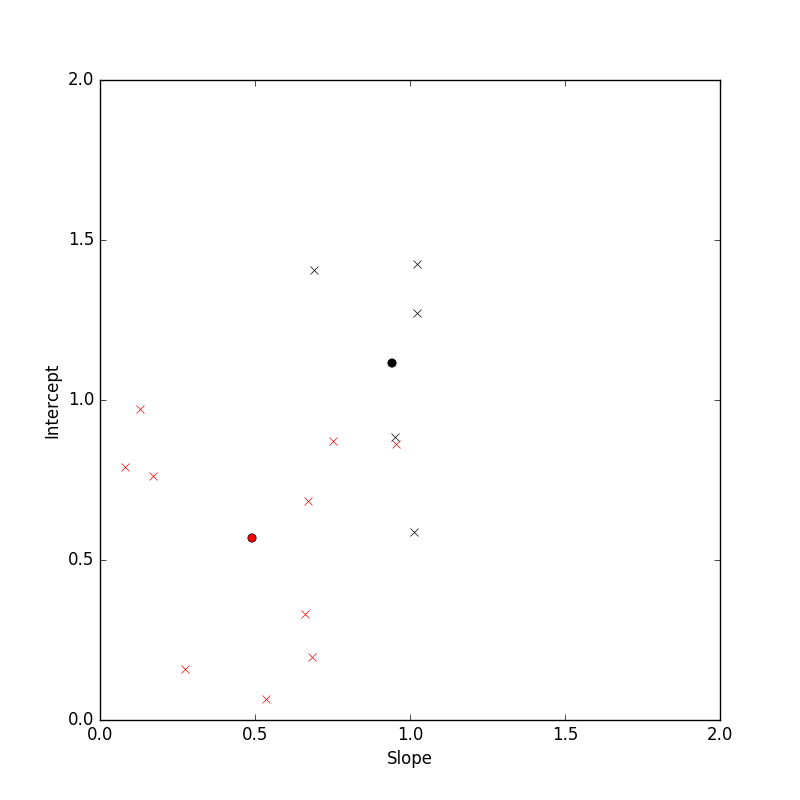
A line is described by its intercept and slope. So you could, for each curve, find those two parameters then get means (and std deviations, etc.) for your two groups.

Below is a plot demonstrating this approach: each 'x' is a slope-intercept pair; the two circles are the means for their respective color groups.

enter image description here

$\endgroup$
5
  • $\begingroup$ Hm... Is this answer cut short? While the basic idea is somewhat interesting (and massively over-parametrized I might add) you seem not to follow-up on this further. OK, you got your $\beta_0$ vs $\beta_1$ now what? How do you check if they are substantial differences? $\endgroup$
    – usεr11852
    Commented Feb 12, 2016 at 19:09
  • $\begingroup$ @usεr11852 The OP's question seemed to be how to map onto 2d space data represented in functions. How to compare the means wasn't mentioned $\endgroup$
    – America
    Commented Feb 12, 2016 at 19:27
  • $\begingroup$ I think the OP explicitly says that he wants: "to demonstrate some general differences between these patient groups." In addition, I think you want to link to a Hotelling test as the data are multivariate and thus unsuitable a t-test as you now link... (Ah, the link has a small section on Hotelling, I take this later back.) $\endgroup$
    – usεr11852
    Commented Feb 12, 2016 at 19:34
  • $\begingroup$ @usεr11852 I would disagree. The OP says "all I want to do is to produce an average curve from each family of curves" $\endgroup$ Commented Feb 12, 2016 at 21:10
  • $\begingroup$ You did not finish the OP sentence dear.... :) $\endgroup$
    – usεr11852
    Commented Feb 12, 2016 at 21:19

Your Answer

By clicking “Post Your Answer”, you agree to our terms of service and acknowledge you have read our privacy policy.

Not the answer you're looking for? Browse other questions tagged or ask your own question.