1
$\begingroup$

I am looking for a good method to combine a set of curves into a single curve.

Those curves have been produced by performing a measurement/testing n-number of times under similar conditions. What I am trying to achieve is to get a single curve which represents statistically the most likely distribution of points if I perform the same test/measurement next time.

Would some type of regression achieve this goal?

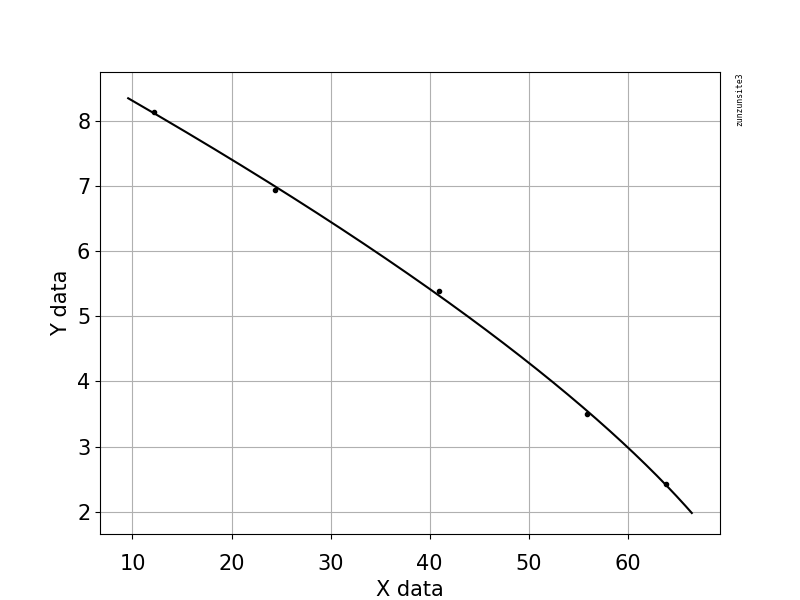
Below you will find some example data for Q (flow) and H (head) for a pump rotating at 1245 rpm. So each measurement at constant rpm gives a curve for Q and H.

Q: 12,1557261    H: 8,1434835
Q: 24,3704478    H: 6,93492
Q: 40,9583469    H: 5,3908751
Q: 55,8666517    H: 3,4994621
Q: 63,8760173    H: 2,4220055
$\endgroup$
4
  • 2
    $\begingroup$ Would you please post a link to example data from several of these measurement runs? $\endgroup$ Commented Dec 11, 2018 at 20:07
  • 1
    $\begingroup$ Most likely yes, regression is fine. One consideration: are these periodic data like a heartbeat where the period has to be estimated statistically? $\endgroup$
    – AdamO
    Commented Dec 11, 2018 at 20:15
  • $\begingroup$ @JamesPhillips Sorry for the late reply. I posted some example data above. $\endgroup$
    – Midas
    Commented Dec 14, 2018 at 10:59
  • $\begingroup$ @AdamO : Sorry for the late reply. The answer is no. It is the flow and head of a pump rotating a constant speed. Regression seems to be doing a nice job, I just don't know if I do this the right way. First I do a multivariate regression where my input is speed in rpm and the output is the flow. Then I do the same thing for speed and head. Then I join those output together to get a curve. The single curve I produced was very very accurate when compared to real life data. Still, I don't know if I was lucky or if I did the right thing. $\endgroup$
    – Midas
    Commented Dec 14, 2018 at 11:03

1 Answer 1

1
$\begingroup$

I found that the Bleasdale yield density equation, "1.0 / pow((a + b*x), (-1.0/c))", gave an OK fit to your example data with parameters a = 2.6123446529575759E+01, b = -3.5195352662517970E-01 and c = 1.4724868235916486E+00 and if you would like to try some other data sets I used my zunzun.com online curve fitter for this specific equation at http://zunzun.com/Equation/2/YieldDensity/Bleasdale/ to perform the fit. I personally think a surface fit of the type "Q = f(H, RPM) might have more utility as a general purpose equation, as a 3D surface equation would allow selection of optimum RPM - this is why I had asked for several data runs, so that I could search for a simple 3D surface equation. Here is a graph of my fit for the Bleasdale yield density equation. bleasdale

$\endgroup$
1
  • $\begingroup$ Thank you! I will give this approach a try and compare to what I achieved using multivariate regression. I'll get back with feedback . $\endgroup$
    – Midas
    Commented Dec 15, 2018 at 14:41

Your Answer

By clicking “Post Your Answer”, you agree to our terms of service and acknowledge you have read our privacy policy.

Not the answer you're looking for? Browse other questions tagged or ask your own question.