1
$\begingroup$

it's a first time I am running regressions for my dissertation and really need your help. I haven't been studying econometrics before, so I don't know if what I am doing is right or wrong.

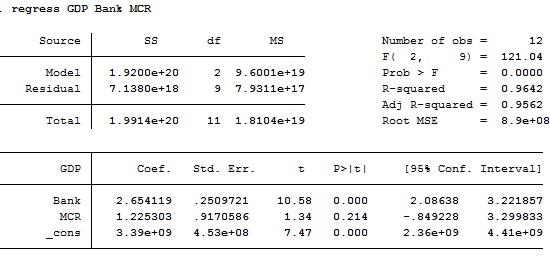
I am looking at the relative effect of banking sector and capital markets on the economy of a particular country, so I wonder how can I interpret this result:

In the model "Bank" is average annual value of deposits at banks deflated by respective inflation rate and "MCR" is real market capitalisation

I am concerned with the very high value of R2 and a high p value of MCR. Can I conclude based on the model that the effect of banks is significant and in terms of markets, they are not yet developed to the stage that will positively impact the economic growth.

Looking forward to your replies!

model

$\endgroup$
2
  • 1
    $\begingroup$ You don't make it explicit but can we assume that your information is in the form of a time series, that it is at the sovereign level and that country form cross-sections? If so, then it is likely that your variables are capturing trend, autocorrelation, cointegration and/or unit root effects. There are many, many books on time series analysis as well as econometrics addressing these issues. For the latter topic, Wooldridge's Econometric Analysis of Cross Section and Panel Data is widely regarded as the best treatment. $\endgroup$
    – user78229
    Commented Apr 1, 2016 at 13:20
  • 1
    $\begingroup$ Did you check for ''spurious'' correlation, i.e. the independent and dependent variables have e.g. both a trend ? More precise; are your series stationary ? see en.wikipedia.org/wiki/Spurious_relationship $\endgroup$
    – user83346
    Commented Apr 1, 2016 at 13:21

2 Answers 2

1
$\begingroup$

I'm no expert so I may be speaking rubbish but it looks like bank is a significant predictor and MCR is not but both do have positive coefficients. I'm wondering if you could say markets do positively impact but it isn't significant.

Did u check assumptions before doing MR?

$\endgroup$
1
$\begingroup$

It's most likely that banks grew over time, and so did GDP, thus breaking the stationary assumption, used in calculating the stdev of the estimator, T statistic and hence p value. You likely need a larger sample or some panel data over other countries

$\endgroup$
2
  • $\begingroup$ Thanks a lot for your prompt response. Unfortunately, the only data available for this particular country is from 2001 to 2012, thus giving only 12 observations in total. Can't I generalize these results stating that the research has limitations concerned with the number of observations? $\endgroup$
    – teo_megre
    Commented Apr 1, 2016 at 13:32
  • $\begingroup$ First of all you'd need to get stationary explained variables by taking differences between observations or assuming a trend and detrending them or something. The problem is that at this point your results will likely not be significant with the current size of the dataset. It's unlikely that this problems will be solved without a larger dataset (at least by adding more countries and having interaction variables for the specific country you're checking) $\endgroup$
    – Moshe Ales
    Commented Apr 1, 2016 at 13:51

Your Answer

By clicking “Post Your Answer”, you agree to our terms of service and acknowledge you have read our privacy policy.

Not the answer you're looking for? Browse other questions tagged or ask your own question.