4
$\begingroup$

I'm having trouble making sense out of the formula $$(\hat{p}_1-\hat{p}_2) \pm 1.96 \sqrt{\frac{\hat{p}_1 (1-\hat{p}_1)}{n_1} + \frac{\hat{p}_2 (1-\hat{p}_2)}{n_2}}$$

Is the idea that the sampling distribution of the difference between proportions of group $1$ and proportions of group $2$ of sample size $n$ is normally distributed regardless of population distribution shape, the same way it is true of the sampling distribution of the sample means, for example?

And in this case, what does that mean exactly? Say we have a sample size of $10$; are we talking about every possible combination of differences between every possible combination of samples of size $10$ for both groups and saying that that "function" is approximately normally distributed? What does it mean to subtract one sampling distribution from another?

And then, where does the square root come from? Is it just the SE of the distribution resulting from subtracting the sampling distribution of sample proportions of group 2 from the sampling distribution of group 1?

$\endgroup$
1
  • $\begingroup$ 1. You're not "subtracting one sampling distribution from another". You're looking at the sampling distribution of the difference of two sample proportions. 2. By basic properties of variance, the variances of the sample proportions will add, but you want the standard error, so you take the square root of the sum. $\endgroup$
    – Glen_b
    Commented Jul 25, 2016 at 3:27

2 Answers 2

5
$\begingroup$

Suppose you have two random variables such that $$X_1 \sim N(\mu_1, \sigma^2_1) \text{ and } X_2 \sim N(\mu_2, \sigma^2_2).$$

If $X_1$ and $X_2$ are independent, then for any $a, b$ $$aX_1 + bX_2 \sim N(a \mu_1 + b\mu_2, a^2\sigma^2_1 + b^2\sigma^2_2). $$

This is by by properties of variance and expectation, and that the sum of two independent normals is a normal. The interpretation of this is not that the sampling distributions are being combined, but in fact that if you scale and add the random variables themselves, then you will end up with that sampling distribution.

If you realized $x_1$ for $X_1$ through one experiment and were to make $95\%$ confidence intervals for $\mu_1$ using this, the standard way to do this would give you $$ x_1 \pm 1.96 \sqrt{\sigma^2_1}. $$

Now, similarly you ran a Binomial experiment, and over $n_1$ draws counted the number of successes. $\hat{p}_1$ is you average (proportion), and the sampling distribution for this is approximately $$\hat{p}_1 \sim N\left(p_1, \dfrac{p_1(1-p_1)}{n_1} \right). $$

Similarly for the second experiment $$\hat{p}_2 \sim N\left(p_2, \dfrac{p_2(1-p_2)}{n_2} \right). $$

If you now need to find a confidence interval for $p_1 - p_2$ you need its approximate sampling distribution. So you let $a = 1$ and $b = -1$.

$$\hat{p_1} - \hat{p_2} \sim N\left( p_1 - p_2, \dfrac{p_1(1-p_1)}{n_1} + \dfrac{p_2(1-p_2)}{n_2} \right).$$

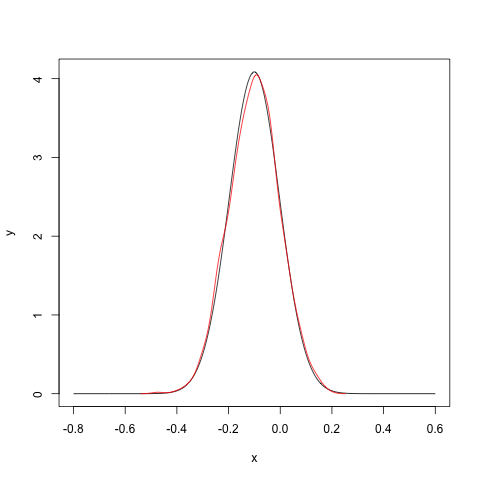
The interpretation of this sampling distribution is that is you get a sample of size $n_1 = 30$ from the first population and calculate $\hat{p}_1$ and get another sample from the second population of size $n_2 = 50$ and calculate $\hat{p_2}$; repeat this experiment 1000 times, and note down $\hat{p_1} - \hat{p_2}$, then these values will approximately following that sampling. distribution. I do this in the following R code.

set.seed(10)

## true values
p1 <- .2
p2 <- .3

n1 <- 30
n2 <- 50

diff_vector <- numeric(length = 1000)

for(i in 1:1000)
{
    X1 <- rbinom(1,n1, p1)
    phat1 <- X1/n1

    X2 <- rbinom(1,n2, p2)
    phat2 <- X2/n2

    diff_vector[i] <- phat1 - phat2
}

## parameters of the sampling distribution
diff_mean <- p1 - p2
diff_var <-  p1*(1-p1)/n1 + p2*(1-p2)/n2

x <- seq(-.8, .6, length = 1000)
y <- dnorm(x, mean = diff_mean, sd = sqrt(diff_var))

plot(x, y, type = "l")
lines(density(diff_vector), col = "red")

The plot below is the output you get. The black line is the sampling distribution expected, and the red line is the distribution obtained through the experiment. You see that they overlap. If you examine the code you will understand that I calculated the difference $\hat{p}_1 - \hat{p_2}$ over 1000 experiments, and then just plotted the density.
enter image description here

Using this sampling distribution you know that a standard $95\%$ confidence interval for $p_1 - p_2$ will be $$\hat{p}_1 - \hat{p}_2 \pm 1.96 \sqrt{ \dfrac{p_1(1-p_1)}{n_1} + \dfrac{p_2(1-p_2)}{n_2}}.$$

This follows just as before.

$\endgroup$
1
  • $\begingroup$ Thank you for taking the time to go into such detail; it took me a while to go through everything but it all makes sense now, and the code was very helpful. $\endgroup$ Commented Jul 24, 2016 at 22:13
3
$\begingroup$

Let me start with the easy part:

What does it mean to subtract one sampling distribution from another?

For most kinds of confidence intervals we start with a point estimate of our parameter and then we add and subtract the radius of interval.

Here you are trying to estimate the difference of proportions between two populations (group 1 and group 2). The most reasonable (and mathematically sound) way to estimate such a difference is to take one sample from each population, count both proportions and subtract them. For example, if in the sample from group 1 you find a proportion of 40% of some event and a 30% in the sample from group 2, your point estimation will be that the proportion is higher in group 1 by 10%.

And in this case, what does that mean exactly? Say we have a sample size of $10$; are we talking about every possible combination of differences between every possible combination of samples of size $10$ for both groups and saying that that "function" is approximately normally distributed? What does it mean to subtract one sampling distribution from another?

I suppose you already understand the distribution of a proportion in one sample. If we have one population, we take the proportion in a sample as a random variable. Here we have two populations and two samples, and our random variable is the difference of the proportions between our two samples - which is the difference of two random variables.

And yes, we are assuming that random variable to be normally distributed - hence the 1,96 value for 95% confidence interval -, but beware that with a sample of size 10 it won't be normal. It's usually suggested the size 30 as a minimum to get a roughly approximation to a normal.

And then, where does the square root come from? Is it just the SE of the distribution resulting from subtracting the sampling distribution of sample proportions of group 2 from the sampling distribution of group 1?

You are right: (estimated) variance of sample proportion in group 1 is $\frac{\hat{p}_1 (1-\hat{p}_1)}{n_1}$ and in group 2 is $\frac{\hat{p}_2 (1-\hat{p}_2)}{n_2}$, and the variance of the sum or difference of two independent variables is just the sum of both variances. Then, we just need to take the square root of variance to get the standard deviation.

$\endgroup$

Your Answer

By clicking “Post Your Answer”, you agree to our terms of service and acknowledge you have read our privacy policy.

Not the answer you're looking for? Browse other questions tagged or ask your own question.