I have data that (in theory) should be normally distributed. But there are additional sources of noise and I want to estimate the likelihood of the data using Student T distribution in order not to penalise outliers too strictly.
How can I do this? I thought that just $(X - \mu) / \sigma$ and likelihood calculation using standard T distribution (i.e. with dt() in r) can help, but it gives obviously wrong likelihood values.
It can be illustrated in r as:
vect <- rnorm(1000, sd=0.05)
likelik <- sum(log(dt(scale(vect, center=0, scale=0.05) , df=1000)))
likelik1 <- sum(log(dnorm(vect, mean=0, sd=0.05)))
Since the df parameter is really big, the T distribution should be close to normal. But, as you can see, the likelihoods are really different.
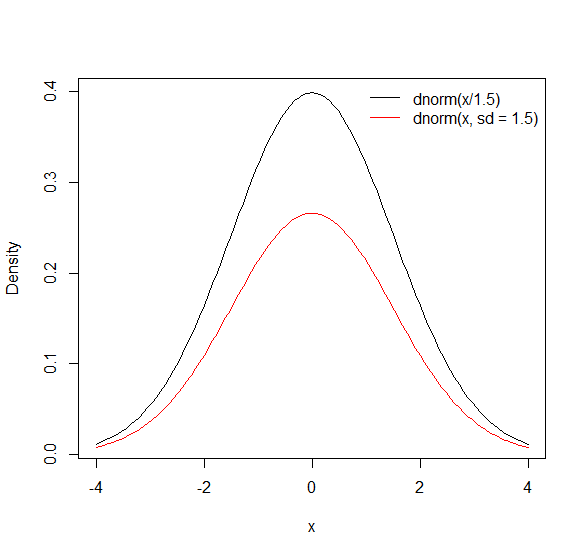
UPD: actually you can normalise likelihood by $1/\sigma$. So
likelik <- sum(log(dt(scale(vect, center=0, scale=0.05) * 1 / 0.05 , df=1000))) seems to be a solution. It can be proven strictly using the integration, I think. Sorry for bothering. If you have something to add or correct, please, write it and I accept the answer.
UPD1: Do not use Student's penalization for dealing outliers in Mixture of Normals. Just use Trimmed BIC instead


log(dt())or it can be evendnorm. The area under the density curve should be equal to 1 so when I normalise by scale the maximum likelihood value that I can get is changing. I will add an example inrto the body of the answer in order to clarify the problem. $\endgroup$scale()calls here just divide by σ. Writing UPD as something along the lines oflikeLik <- sum(dt(vect / stdDev, log = TRUE) - log(stdDev))may thus be preferred for clarity and numerical stability (also, beyond the question, it's a convenient form in weighted regression wherestdDevis a vector). $\endgroup$