5
$\begingroup$

Here's a transcript of the first minute, though you may watch the video here:

The F distribution is positively skewed, meaning it peaks on the left side and is stretched off to the right side. This distribution peaks at 1. This is because if there are no differences in the population means, in other words the between group variability is expected to be 0. Then the mean of each sample will still, likely differ by chance. Since the difference, then, is due to chance. The same way that each subject in each sample differs by chance, as measured by the within-group variability. Then the between group variability and within group variability will be the same. Therefore, when we divide them we get 1. And that's where this distribution peaks.

A visit to wikipedia shows F-distributions that do not peak at 1. Does the video use a detail that I'm not aware of to generate F-distributions that only peak at 1? Or is the video correct (F-distributions always peak at 1) and I'm missing a detail somewhere when looking at these F-distributions that seemingly don't peak at 1?

$\endgroup$
2
  • $\begingroup$ Not sure of the context, but perhaps for simplicity they are just describing the "large sample limit" case? (The Wikipedia formula for the mode goes to one as the dof parameters go to infinity.) $\endgroup$
    – GeoMatt22
    Commented Sep 3, 2016 at 2:55
  • $\begingroup$ @GeoMatt22 True, but when I plug in large degrees of freedom into the following site, the f-distribution becomes symmetric and more like the normal distribution, and doesn't resemble what the narrator drew. statdistributions.com/f $\endgroup$ Commented Sep 3, 2016 at 3:03

1 Answer 1

3
$\begingroup$

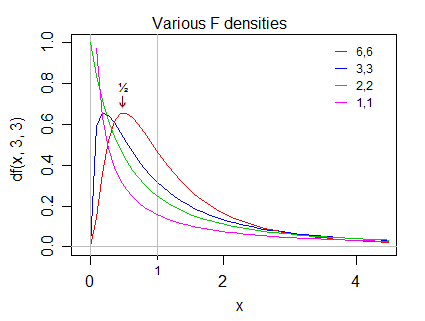
The mode of the F distribution with $d_1$ and $d_2$ degrees of freedom is at ${\frac{d_{1}-2}{d_{1}}}\;{\frac{d_{2}}{d_{2}+2}}$ for $d_1\geq 2$ (and otherwise the pdf asymptotes to the y-axis at 0).

The expression for the mode is a product of two terms, each less than 1 ... which is to say the Udacity statement is never actually true.

For example, with 6 and 6 df the peak is at $\frac12$.

Various F densities showing the modes to the left of 1

However, when the numerator and denominator df are both large, it can be close to true.

By contrast, the mean (when it exists) of a random variable with an F distribution is $\frac{d_{2}}{d_{2}-2}$ (for $d_2>2$), which is always greater than 1.

$\endgroup$

Your Answer

By clicking “Post Your Answer”, you agree to our terms of service and acknowledge you have read our privacy policy.

Not the answer you're looking for? Browse other questions tagged or ask your own question.