2
$\begingroup$

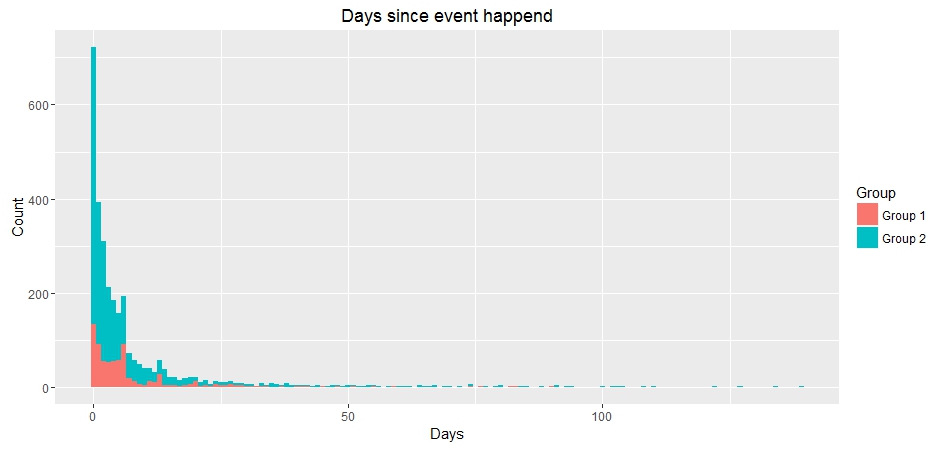
I've got a dataset with observations about how long since an event occured for each subject (e.g. how many days since a subject visited the site). The subjects are divided into two groups (e.g. related to in what way they unsubscribed from the page). The groups are of different sizes as well.

I want to find out if there are a difference in the mean expected number of days before the event happens dependent on what group the subject are in.

The problem is that the distribution is heavily skewed. If it had been normaly distributed, I would just run a regular T-test. So what do I do now when the distribution is heavily skewed, and a t-test is not working?

This is the distribution of the data: enter image description here
Im doing my computations in R, so a solution to how to do it there would be great as well.

$\endgroup$
3
  • $\begingroup$ Days since event is not counting data, it is duration data. Maybe this could help you: stats.stackexchange.com/questions/109566/… $\endgroup$ Commented Sep 17, 2016 at 13:21
  • $\begingroup$ This might be useful: cemfi.es/~arellano/duration-models.pdf $\endgroup$ Commented Sep 17, 2016 at 13:28
  • 2
    $\begingroup$ Good point! I've used Cox PH on the dataset for other analysis, but in this specifically case i just wanted to do a a simple "comparison if the means". But I guess you are right - this analysis should be done using some sort of survival analysis as well. Thanks for the answer. $\endgroup$ Commented Sep 19, 2016 at 11:03

2 Answers 2

2
$\begingroup$

There are two specific tests which are handy for your situation. The Z-test for comparing two counts (Poisson distribution) and the F-test for two counts.

I start with the Z-test. This test is designed to examine the significance of the differences between two counts following the Poisson distribution. The test is approximates and assumes that the number of counts are large aenough for the normal approximation to the Poisson to apply.

The Z-Statistic is computed in the following way.

\begin{align} Z &= \frac{(R1-R2)}{R1/t1 + R2/t2} \\\\ \end{align} And now comes the F-Test for two counts (Poisson distribution). This test investigates the significance of the difference between two counted results on a Poisson distribution. The underlying assumption is that both samples were obtained under similar conditions. The test statistic can be stated in the following way.

\begin{align} F &= \frac{N}{N2 +1} \\\\ \end{align}

A more exact test statistic taking into account the degrees of freedom looks like this.

\begin{align} F &= \frac{1/t1 * (n1 +0.5)}{1/t2 * (N1 + 0.5)} \\\\ \end{align}

For a more detailed discussion read the book 100 statistical tests by Gopal K.Kanji

$\endgroup$
1
$\begingroup$

I (also) suggest doing a survival analysis type model. Proportional hazard models with 2 classes are quite frequent for the analysis of "days until event" type of data. Look for the "survival" package in R. The whole topic requires a bit of getting used to, but seems to be the appropriate to handle this type of data.

$\endgroup$

Your Answer

By clicking “Post Your Answer”, you agree to our terms of service and acknowledge you have read our privacy policy.

Not the answer you're looking for? Browse other questions tagged or ask your own question.