1
$\begingroup$

I am trying to test the significance of the difference between two populations.

Here is a link to the population 1 data: http://pastebin.com/914mCRqA

and population 2 data: http://pastebin.com/PmDgLLAb

Could someone tell me whether it is best to use median or mean and hence what test to use?

I was thinking of using the sign test for medians, but I can't find any tables with large n and I'm not sure if median is the most suitable measure. I've done a Z-test but not sure if that is suitable as well. Thanks.

$\endgroup$
3
  • 2
    $\begingroup$ How is the sample data non-random? $\endgroup$
    – jbowman
    Commented Feb 25, 2012 at 17:48
  • 1
    $\begingroup$ If you have full population data, any difference is real and you don't need statistics tests. Do you have sample or population data? $\endgroup$
    – Michelle
    Commented Feb 25, 2012 at 18:44
  • $\begingroup$ I'm not really sure what sort of data it would be. The data is actually a set of genes involved in one process (Wnt signalling) v the set of all genes that are not part of that set. $\endgroup$
    – R Evans
    Commented Feb 25, 2012 at 18:55

1 Answer 1

2
$\begingroup$

Nearly all significance tests rely on your having a random sample from the population. (The exceptions, as @Wolfgang has pointed out, follow a randomization model.) Obtained results are compared to what would be expected if the population were randomly sampled and the null hypothesis were true. That is the basis for most p-values, T-statistics, Z-statistics, and so on. Many people working with a nonrandom sample gloss over this fact and report p-values, etc. anyway. But if the audience for your research is sophisticated, they will know the difference.

[edit following comment] Regarding sampling: As @Michelle said, if you have a census of the Wnt genes of interest and a census of the other genes of interest, then there is no need for inferential statistics. But if you have a sample from the Wnt population and a sample from the other population and both samples have been selected non-randomly, then inferential statistics will not achieve "nominal" (promised/assumed/supposed) levels of accuracy. However: to the extent that you can demonstrate that your samples are representative of their respective pop's. (and that they function like random samples), you may be able to convince your audience that your inferential results are valid.

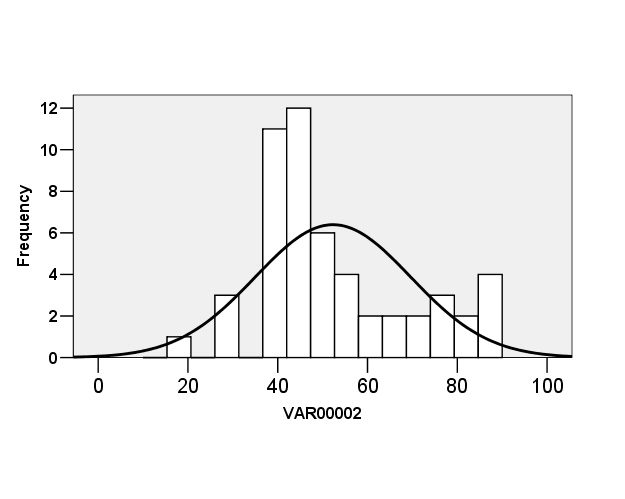
Regarding mean vs median: your 2nd sample is markedly non-normal, making a test of medians or ranks much better than one of means.
enter image description here

You could look into the Mann Whitney U Test or the Median Test. To my understanding the Sign Test wouldn't fit because it's designed for 2 dependent samples. HTH

$\endgroup$
1
  • $\begingroup$ The data is actually a set of genes involved in one process (Wnt signalling) v the set of all genes that are not part of that set. I've separated the two sets of data now but still not sure how to proceed. $\endgroup$
    – R Evans
    Commented Feb 25, 2012 at 18:48

Your Answer

By clicking “Post Your Answer”, you agree to our terms of service and acknowledge you have read our privacy policy.

Not the answer you're looking for? Browse other questions tagged or ask your own question.