10
$\begingroup$

As explained on this Wikipedia page, if two random variables X and Y are uncorrelated and jointly normally distributed, then they are statistically independent.

I know how to check whether X and Y are correlated, but have no idea how to check whether they are jointly normally distributed. I hardly know any statistics (I learnt what a normal distribution is a couple of weeks ago), so some explanatory answers (and possibly some links to tutorials) would really help.

So my question is this: Having two signals sampled a finite number of N times, how can I check whether the two signal samples are jointly normally distributed?

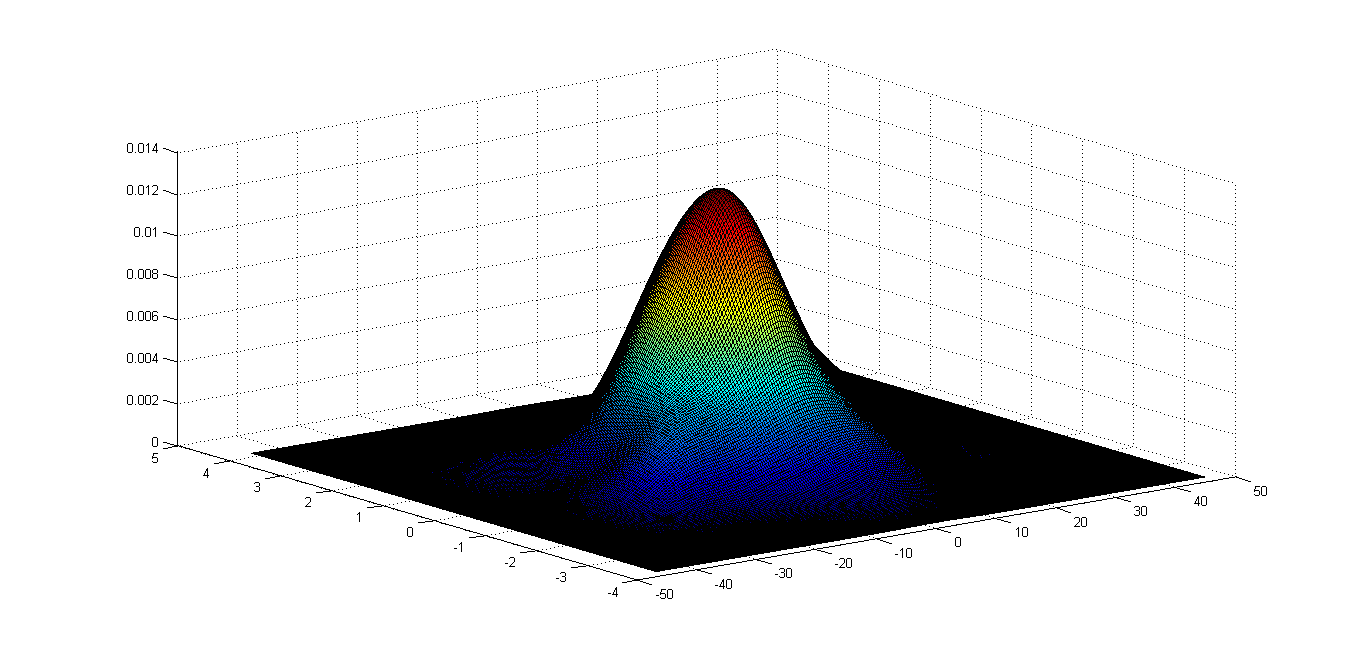
For example: the images below show the estimated joint distribution of two signals, s1 and s2, where:

x=0.2:0.2:34;
s1 = x*sawtooth(x); %Sawtooth
s2 = randn(size(x,2)); %Gaussian
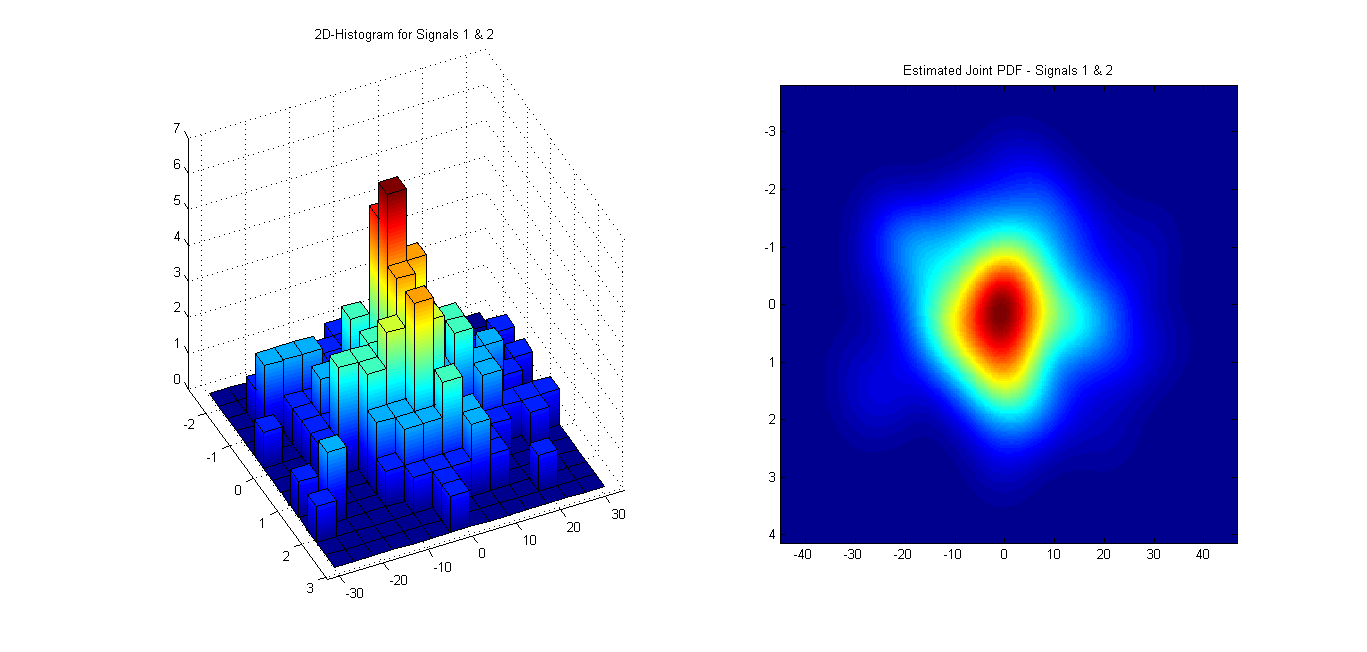
enter image description here enter image description here

The joint pdf was estimated using this 2D Kernel Density Estimator.

From the images, it is easy to see that the joint pdf has a hill-like shape centred approximately at the origin. I believe that this is indicative that they are in fact jointly normally distributed. However, I would like a way to check mathematically. Is there some kind of formula that can be used?

Thank you.

$\endgroup$
2
  • $\begingroup$ This is a simulation where you begin with signals that are not jointly normal by construction, and your statistical procedure seems to be showing that one can be reasonably confident that the signals are in fact jointly normal. So, should you be checking whether (a) the statistical method was applicable, or correctly applied, or correctly interpreted, or (b) your signal generation method is leading to signals that are in fact jointly normal even though a prima facie case cannot be made for joint normality (as would be the case if s1 = randn(size(x,2));; s2 = randn(size(x,2));?? $\endgroup$ Commented Mar 12, 2012 at 13:00
  • $\begingroup$ @DilipSarwate That would be (b). I want a way to check whether the joint distribution is in fact normal. $\endgroup$
    – Rachel
    Commented Mar 12, 2012 at 13:08

2 Answers 2

6
$\begingroup$

Apart from graphical examination, you could use a test for normality. For bivariate data, Mardia's tests are a good choice. They quantify the shape of your distributions in two different ways. If the shape looks non-normal, the tests gives low p-values.

Matlab implementations can be found here.

$\endgroup$
0
2
$\begingroup$

This is more an extended comment than an effort to improve on the specific suggestion of @MånsT: Statistical test by and large are not tests for what distribution produced data but rather which ones did NOT. There are a few tests which are "tuned" to give answers to the normality question: Is this NOT from a Normal Distribution. The one sample Kolmogorov-Smirnov test is fairly widely known. The Anderson Darling test is perhaps more powerful in the one-D case. You should seriously ask yourself, WHY is the answer important? Often people ask the question for the wrong statistical purposes. Your example has demonstrated that your graphics-eyeball test has low power against an alternative composed of a sawtooth-Gaussian alternative, but you have not shown how that failure affects you underlying question.

$\endgroup$
6
  • $\begingroup$ In this instance, the alternative sawtooth-Gaussian is in fact true since that's how the data was produced, but the graphics-eyeball test is suggesting that the null (jointly normal) should not be rejected. Most statisticians understand that non-rejection of the null is not the same as acceptance of the null, but the OP wants a mathematical reason for turning non-rejection of the null into a whole-hearted embrace of the null as the received truth (the facts be damned). $\endgroup$ Commented Mar 12, 2012 at 15:56
  • $\begingroup$ Yes. The fact that his attempt at testing his simulation had failed to properly reject was understood (as earlier you commented). How one should approach the the problem of low power for a method is central to statistical thought and it wasn't clear he had a firm grasp of the underlying principle. But I didn't conclude that he was requiring that a mathematical test ratify his eyeball result. $\endgroup$
    – DWin
    Commented Mar 12, 2012 at 16:09
  • $\begingroup$ @DilipSarwate If I can't prove that the joint distribution is normal, I would like to show that there is a good probability that it in fact it. I am not a statistician by any stretch of the imagination, but wouldn't non-rejection of the null at least be a good indication? $\endgroup$
    – Rachel
    Commented Mar 12, 2012 at 19:07
  • $\begingroup$ @DWin Maybe you're right and I haven't grasped the underlying principle well enough. Like I said, I'm a statistics newbie! I know that two variables can in fact be jointly normally distributed, and would just like a way to check whether this is true (at least with a certain level of confidence/probability). And PS: just a small note - it's a she, not a he. $\endgroup$
    – Rachel
    Commented Mar 12, 2012 at 19:11
  • $\begingroup$ @Rachel What you are trying to "prove", viz. that the two signals are jointly normal is prima facie not true since one was generated as a sawtooth signal and the other is Gaussian noise. But you nonetheless feel that they are jointly normal, and that your test gives reasonable grounds for such a belief. As the Red Queen said to Alice, "Sometimes I have believed as many as six impossible things before breakfast." So, be confident that your graphics/eyeball test does in fact allow you to conclude with some confidence that the two signals are in fact jointly normal, and proceed forthwith. $\endgroup$ Commented Mar 12, 2012 at 19:28

Your Answer

By clicking “Post Your Answer”, you agree to our terms of service and acknowledge you have read our privacy policy.

Not the answer you're looking for? Browse other questions tagged or ask your own question.