I'm editing this question in hopes of improving it, and thus receiving some advice on it.
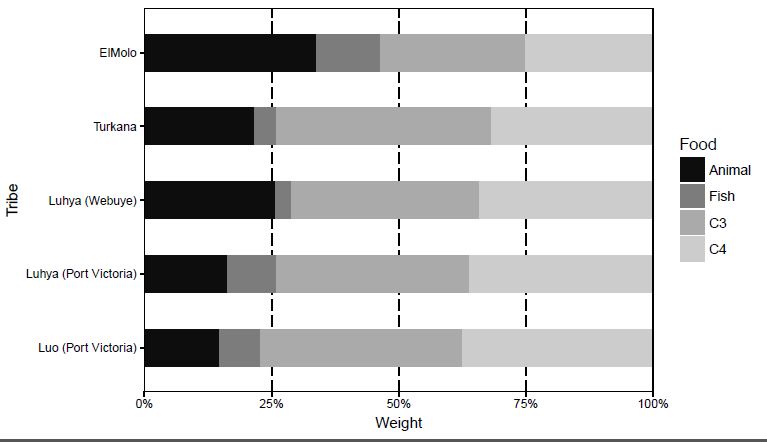
I have collected info on diet from several populations. There are different groups (e.g. ElMolo) made of individuals and each individual eats different foods (e.g. cheese). Each food has a specific weight (g) (dependent variable) Also, each food is classified to a category (e.g cheese is animal).
Goal: I want to know if the proportion of each food category (e.g. animal) changes significantly accross populations (e.g. Webuye). For instance, do ElMolo eat proportionaly more animal foods than the other populations?
Below is a graph to illustrate my results:

Questions:
I believe I should not do an ANOVA on the frequencies, but instead do a loglinear analysis using a contingency table. Is this correct?
Before applying loglinear analysis, I need to build a contingency table. I tried this:
ContingencyTable2<-xtabs(Weight~Food+Tribe, data=AllDiet)
However my data is raw: so Weight is weight of food in g per individual (i.e the data is not in frequency). Here it says that "If a variable is included on the left side of the formula, it is assumed to be a vector of frequencies (useful if the data have already been tabulated)." So do I need to calculate the frequencies before building the contingency table or is there another way to do this?
Any help is appreciated! Thank you

Freq&Weight? $\endgroup$