Thanks for sharing your data (available from me) detailing 24 hours of data for 884 consecutive days (start date: 5/1/14) representing emergency room visits to a hospital. Your stated task was to simply predict the next 8 hours. We have routinely developed forecasts like this for manpower planning purposes. I believe by using ARIMA methods you are asking the wrong question . An ARIMA model uses what occurred in recent hours and recent days via seasonality of 24 and 7 to project forward based upon these previous values. Essentially the answer is to the question "How do I use previous values to make a weighted average forecast"
The truth of the matter is that you should make a forecast for the next 8 hours taking into account 1) the hour effect , 2) the day-of-the-week effect and changes in the day-of-the-week effect , 3) the month-of-the-year effect , 4) holiday effects , 5) possible long-weekend effects , 6) overall global trends/level shifts affecting the hospital while also adjusting for any additional memory effects from previous days all while identifying/ignoring unusual values as not being representative of process. In this way you are identifying possibly significant assignable cause to a number of possibly usefuly deterministic variables.
Although you only wanted the next 8 hours for the next day , I used 24 hours for the next 365 days to help illustrate the guidance available from this approach .
Please review Time series model of intraday data on weekdays and weekends
and it’s threads as it will help you understand the general direction of mixed frequency modeling … see my comment and referenced url’s
I took your daily total series and automatically developed a model (presented at he end of this response ) which generated forecasts to guide the hourly predictions. This is the plot of the Actual/Fit and Forecasts for the Daily Totals.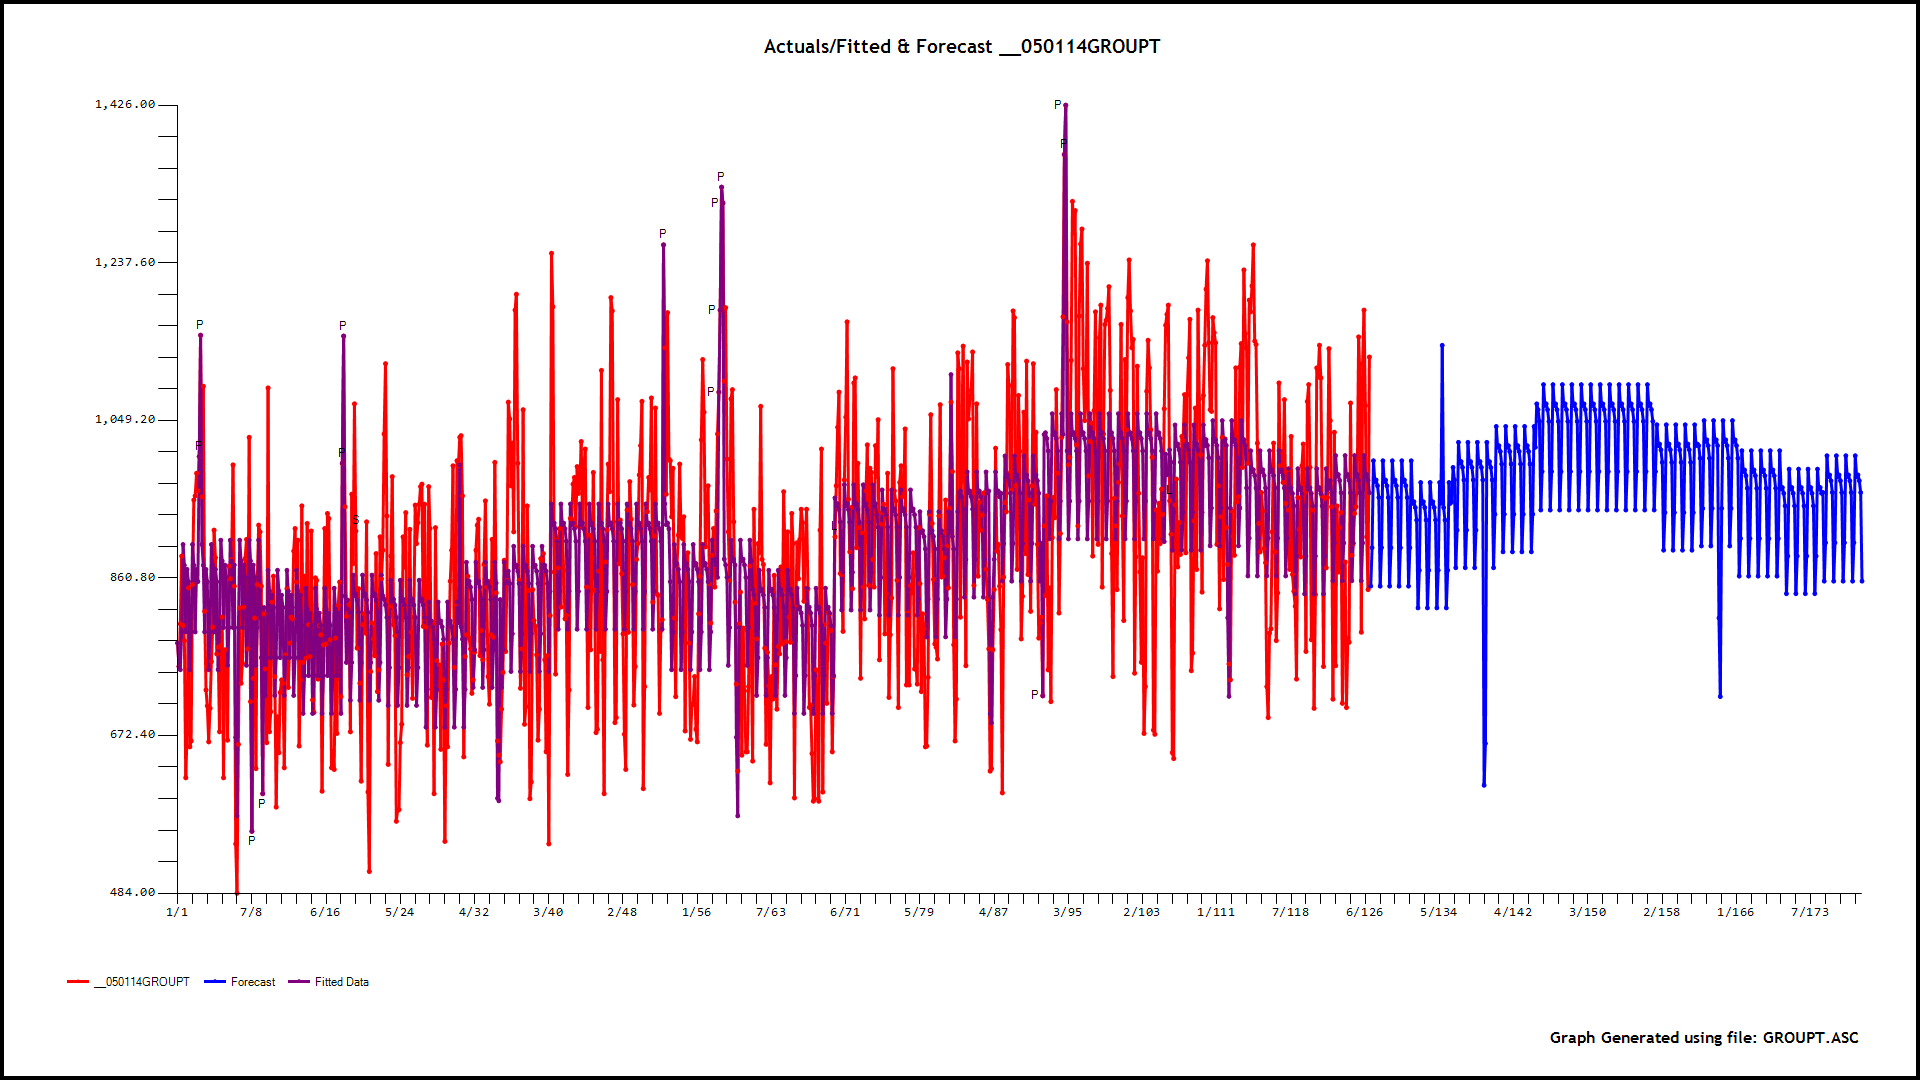 . The model is interesting as it identifies the major level shift in the series , the downside predictions for Saturday and Sunday , and the monthly effects suggesting changing emergency through the year. Here is the model in two parts ..
Now 24 individual model were developed using the GROUP(DAILY) TOTAL as a possible predictor. Like children some follow the parent more closely and some don't.
I present here the Actual/Fit/Forecast for hour 1 (12:00 pm to 1:00 am ).
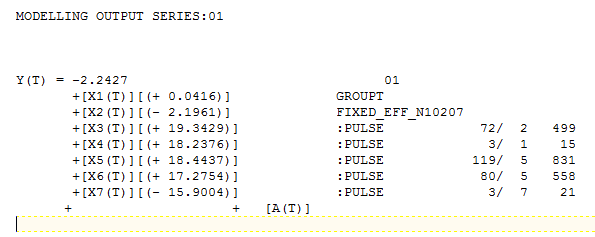
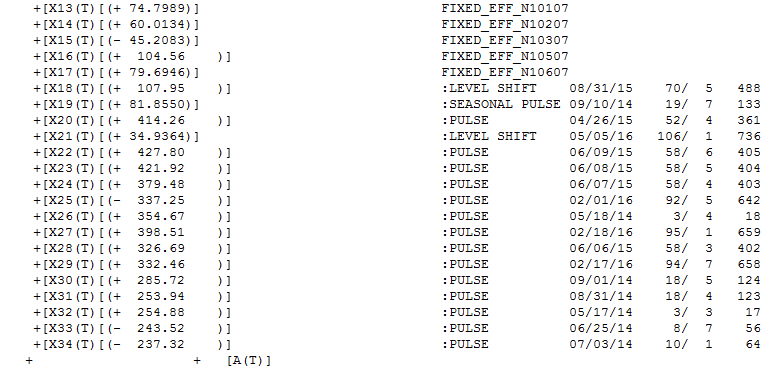
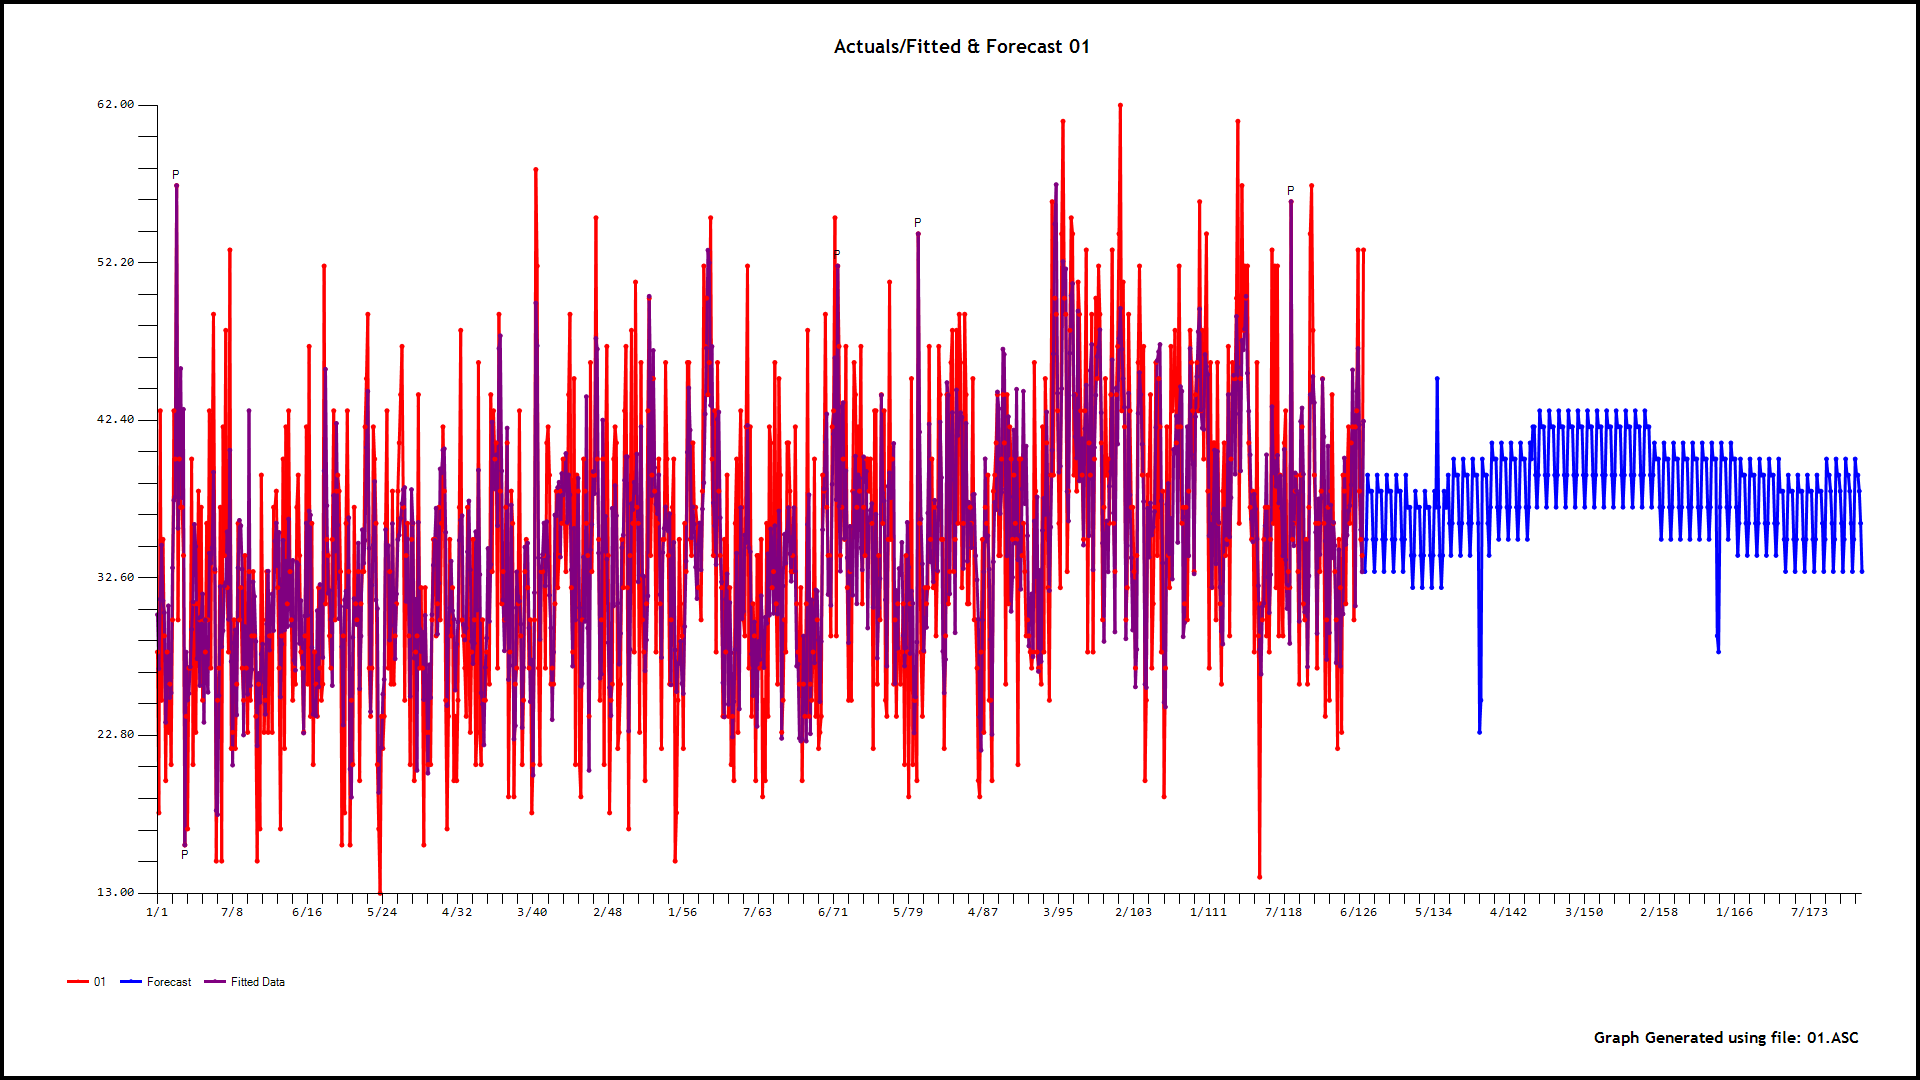 . The model for Hour 1 is here
  and Hour 8 is here
 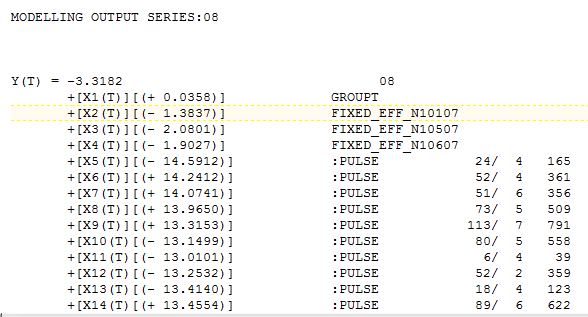 . It is interesting ( at least to me ) how different they are in terms of unusual values and varying days-of-the-week effects sort of suggesting that Hour1 is easily predicted while Hour8 is less easily predicted due to much higher volume levels, daily effects and an increased # of random/unpredictable arrivals.
The ACTUAL/FIT/FORECAST respectively (note the scaling is different ... don't let your eye be fooled ! )
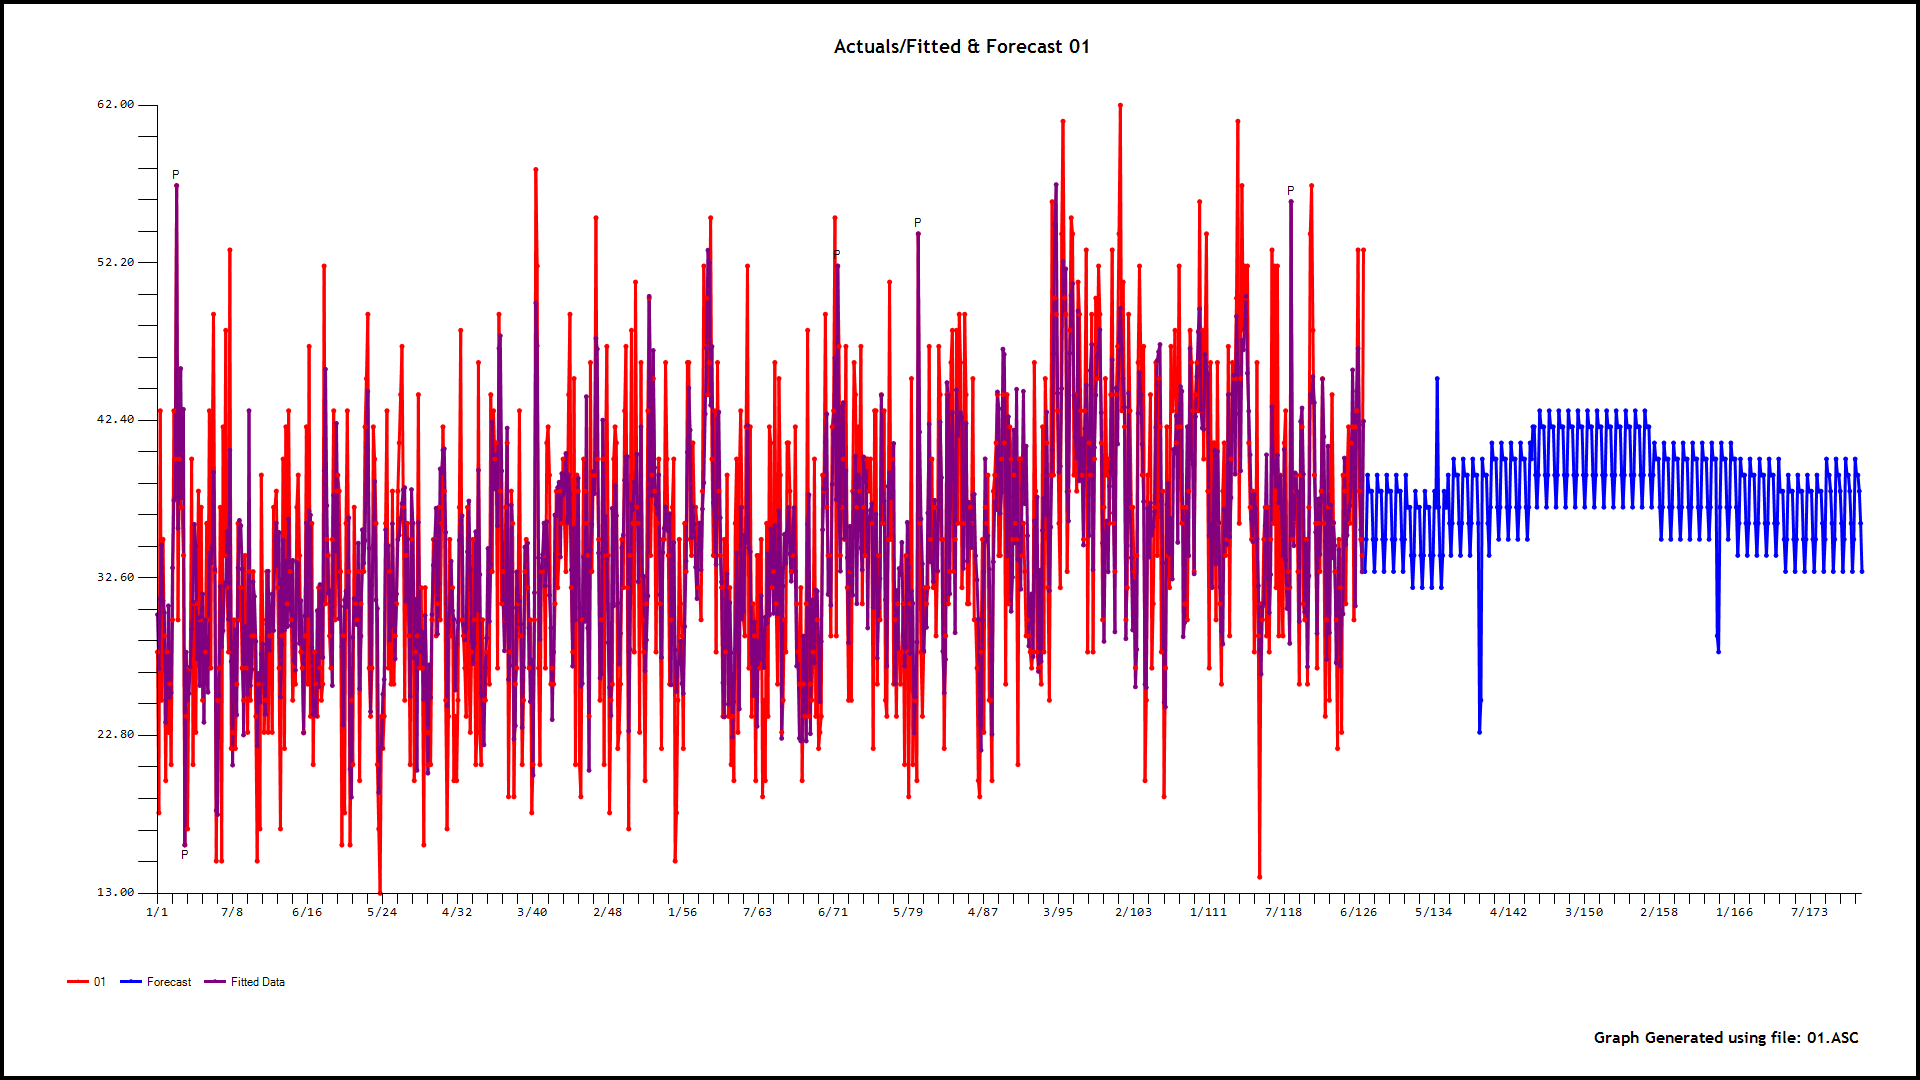 and
and 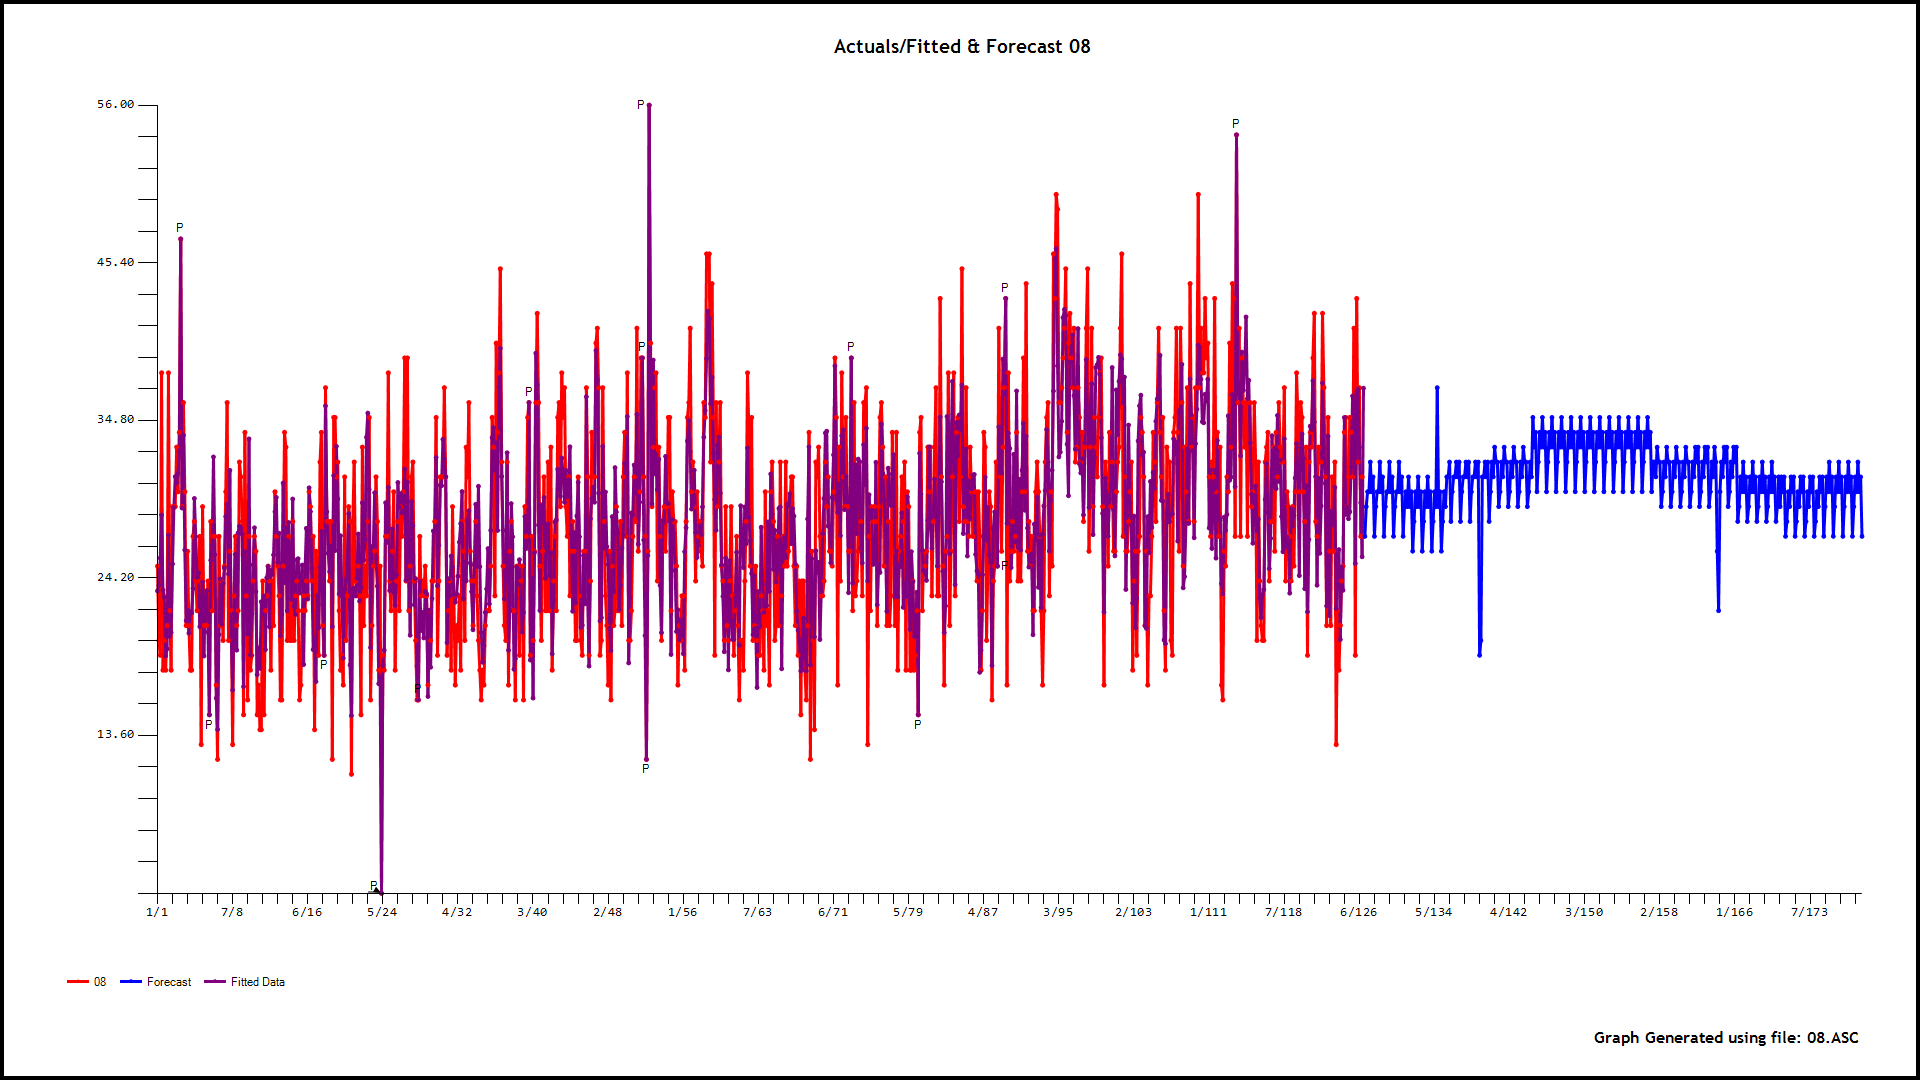
After reconciling the children to the parent ( an option ) here are the forecasts for the next 8 hours (13 hours shown for day 1 in the future)
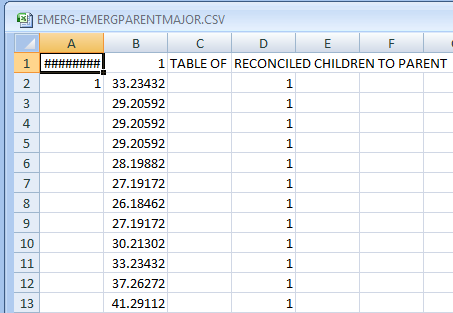 ...
...
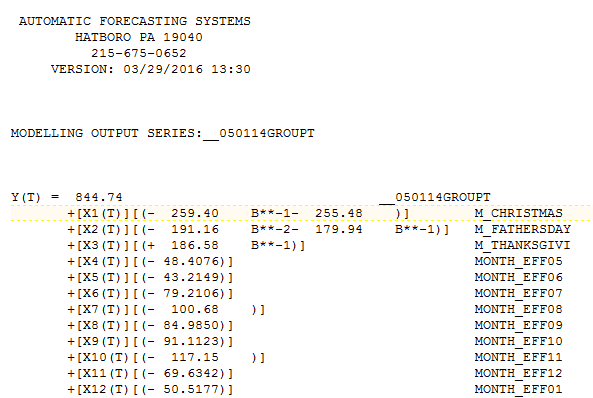 and here
  . Recall all models are wrong and some are even worse. The important thing is that existent domain knowledge ( auxiliary/helping X's ) should be used wherever possible to improve comprehensive understanding e.g. population trends , competition , price etc .
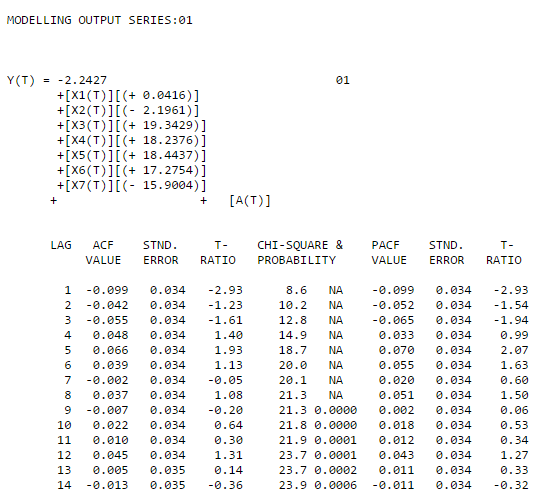
EDIT : ADDED ACF OF ERRORS FOR HOUR 1 MODEL


frequencyof your time series to be 23 or 22 in place of 24? Nothing much behind this, just looking at the spikes around these lags... $\endgroup$