5
$\begingroup$

So I am trying to use time series analysis using E-views to forecast my data about the number of occurrence of earthquakes with magnitude greater than or equal to zero in a certain country. Attached below is my data.

year;eq
1911;1 1921;1 1931;0 1941;1 1951;0 1961;0 1971;0 1981;0 1991;1 2001;1 2011;0
1912;0 1922;0 1932;0 1942;2 1952;1 1962;0 1972;2 1982;1 1992;2 2002;1 2012;1
1913;1 1923;1 1933;0 1943;2 1953;0 1963;0 1973;1 1983;0 1993;1 2003;0 2013;1
1914;0 1924;2 1934;2 1944;0 1954;0 1964;0 1974;0 1984;1 1994;1 2004;0 2014;0
1915;0 1925;1 1935;0 1945;0 1955;1 1965;0 1975;1 1985;1 1995;2 2005;0 2015;0
1916;0 1926;0 1936;0 1946;0 1956;0 1966;0 1976;1 1986;0 1996;1 2006;0
1917;0 1927;0 1937;1 1947;1 1957;1 1967;0 1977;1 1987;0 1997;0 2007;0
1918;1 1928;1 1938;2 1948;2 1958;0 1968;1 1978;0 1988;1 1998;0 2008;0
1919;0 1929;2 1939;0 1949;1 1959;0 1969;0 1979;1 1989;1 1999;2 2009;0
1920;0 1930;0 1940;0 1950;0 1960;0 1970;2 1980;0 1990;2 2000;0 2010;3

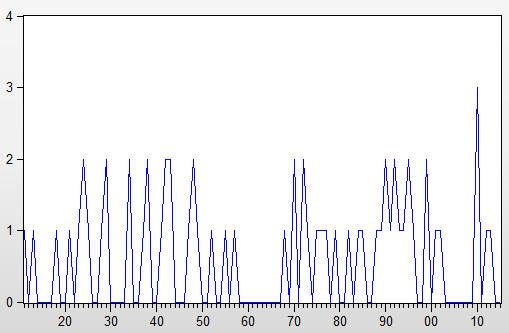
Here is the graph of my data:

enter image description here

According to ADF test, my data is stationary at first differencing.

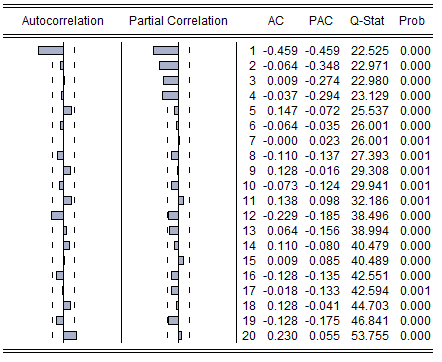
Here is the correlogram of my series:

enter image description here

The plots suggest an MA(1) model, right?

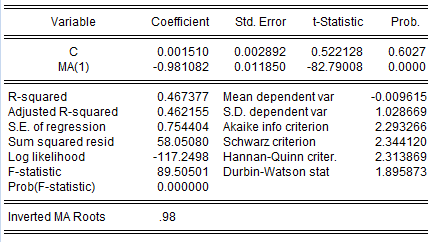
So here is the estimation output of the MA(1) model:

enter image description here

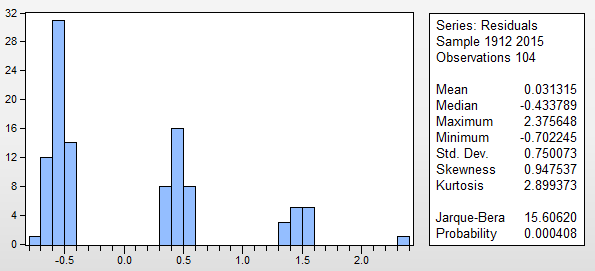
My problem is on the assumptions that need to be satisfied by the residuals of the model.The residuals of the model should be normally distributed, independent, and has a constant variance (homoscedasticity), right? My MA(1) model does not satisfy the normality assumption.

enter image description here

What is the consequence if the assumption of normality is not met? or What are the consequences of not meeting the assumptions for residuals of the model?

Are my procedures okay? Or should there be other methods that can be used for my data?

$\endgroup$
1
  • $\begingroup$ when u have found your answer accept the one you like to close the question. $\endgroup$
    – IrishStat
    Commented Dec 19, 2016 at 17:53

1 Answer 1

1
$\begingroup$

To begin with your data is discrete ( fixed # of values that can arise e.g. hour in the day ) while the ADF test requires a large number of assumptions one of which is the data is continuous ( large # of values that can arise like time ). Your software utilization (who should have warned you about this deficiency/limitation ?) is invalid and all results are meaningless. A periodic sequence of consecutive zeroes incorrectly suggests high correlation between successive values thus ADF incorrectly suggests first differencing.

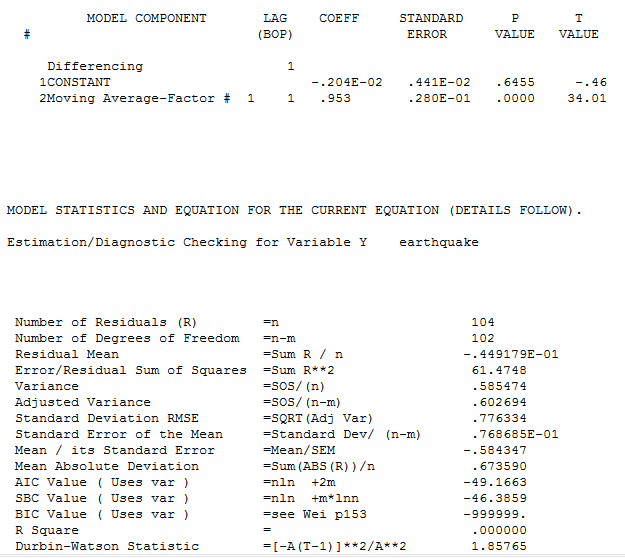
To give you an idea of your unfortunate suggested model your ma(1) coefficient is -.98 (nearly -1.0) effectively cancelling your mis-specified differencing operator. I took your 105 values into AUTOBOX , a piece of time series software that I have helped to develop, and (using a slightly different estimation algorithm) and assumed your model . I obtained a coefficient of enter image description here -.953 and an R-Square of 0.0 reflecting the redundancy. Curiously your software reported an R-Square of .457 which motivated some research on my part. If one unnecessarilly differences a series then one is injecting structure and the new series will have greater variance Variance of difference of $x_{i,t}$ and $x_{i,t+1}$ . If one then models this inflated series with an MA(1) then one can then get an R Squared of .457 .This reporting of the R Squared of the differenced series as compared to the R squared of the observed series is very bad statistics in my opinion and represents an inability to deal holistically with the observed series and the ARMA struture. Software is just as good as the last time it was checked . This is poor practice and defintely non-standard. There is nonsense and there is nonsense but the most nonsensical of them all is statistical nonsense.

Now continuing with possible analyses .... your data reflects the impact of two random variables viz. 1) the time between shocks (eathquakes) and 2) the magnitude of the shock (earthquake). I have used two different approaches for data like this.

APPROACH 1:

Computing and interpreting ACF's and PACF'S for discrete data is problematic. Note that the classic airline series (# of passenger miles) from Box and Jenkins is discrete data BUT a large number of values can arise thus all is well and it passes as approximately continuous.

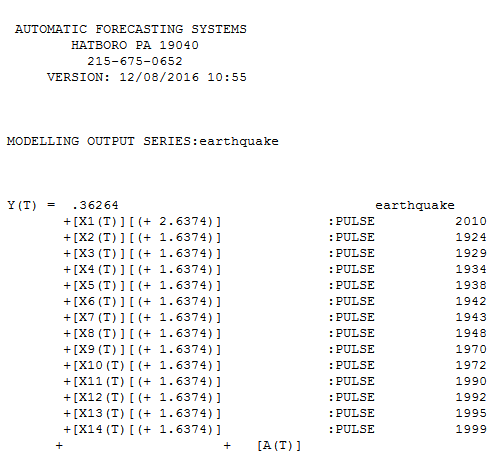
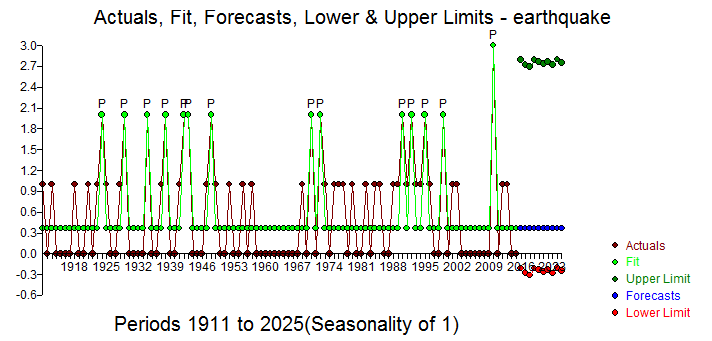
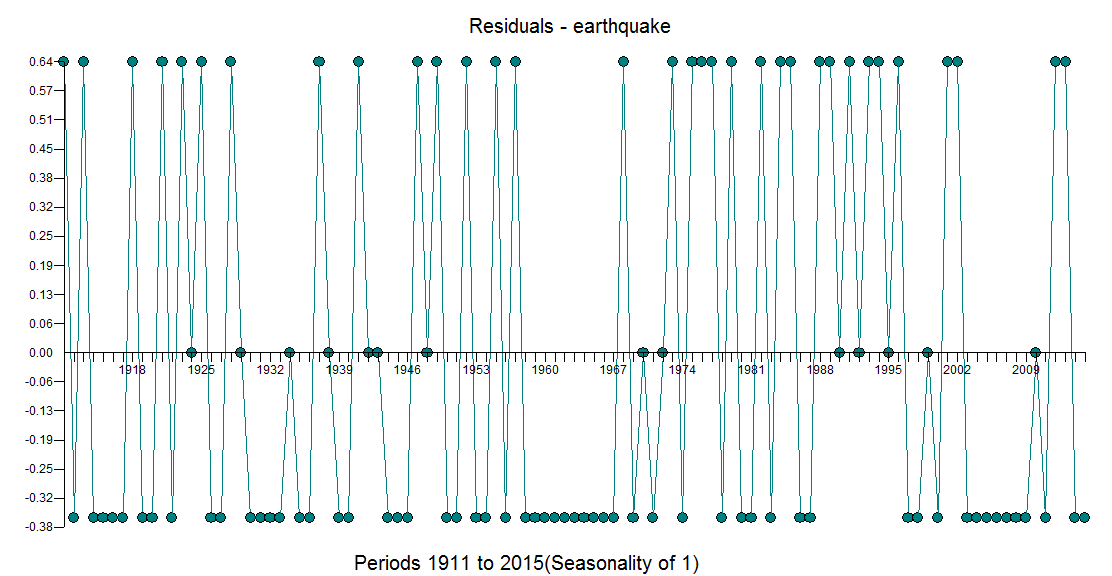
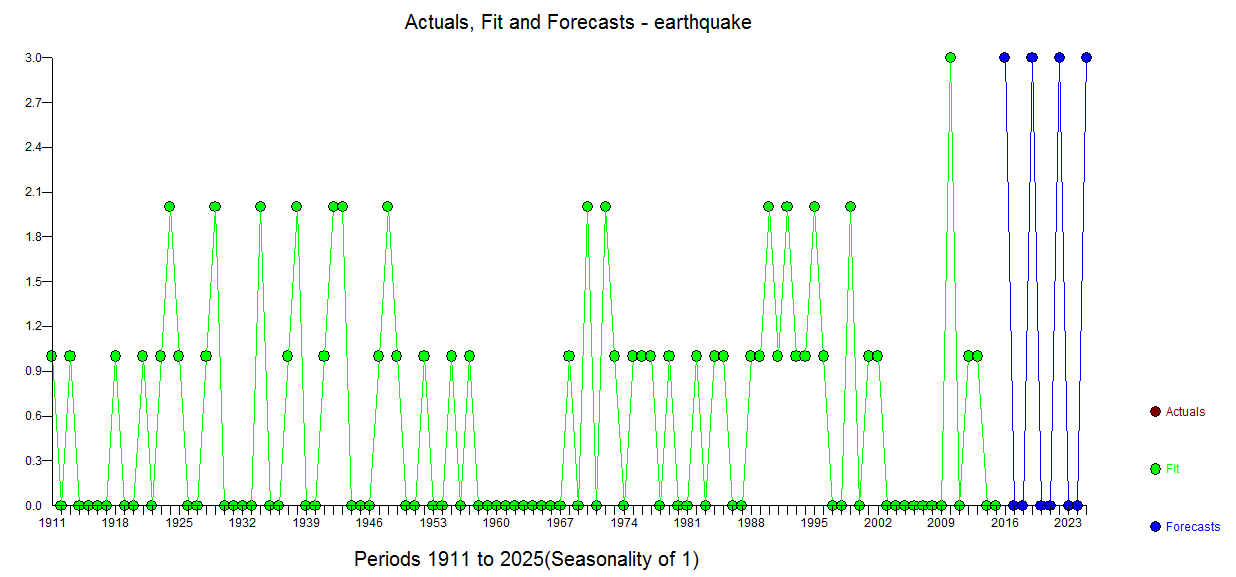
ARIMA modeling with Intervention Detection providing reasonably robust solutions. For this data AUTOBOX found the data to be stationary (without memory) AND number of anomalies i.e. one-time pulses. This is the equation enter image description here and visually showing Actual/Fit and Forecast enter image description here . Note that the level of the series appears to be stable with periodic shocks ( 1 time pulses) . The Confidence Limits are computed by resampling the (decidedly non-normal error process enter image description here ) and allowing for re-occurrence of the empirically identified pulses. Since negative earthquake numbers can not exist simply replace the lowerlimit (red) valiues with 0.0 . Not much more to be said about this as we are pushing the aboundaries of where ARIMA might apply . Certainly if we had n discrete possible values and a large enough history of all possible values a markov switching model might apply GIVEN that anomalies had been silenced (treated).

APPROACH 2:

The time series literature includes something referred to as Intermittent Demand or AKA Sparse Data Anlysis . In this section I will outline and demonstrate that method to solve this complex problem (aren't they all !) . Copute the time between non-zero evbent. For each of those intervals compute the Rate (observation divided by # of intervals between events) . Construct a Transfer Function between Rate and Interval Size identifying level shifTs and pulses as needed to predict Rate . Use the Interval data to predict the next interval and use that predicted interval to compute the size of the earthquake. This is a superset/modification of Croston’s method. This procedure has served us well by actually developing a forecast for both the interval and the demand (in this case magnitude of the earthquake)

APPROACH 3:

Certainly if we had n discrete possible values and a large enough history of all possible values a markov switching model might apply GIVEN that anomalies had been silenced (treated). I will leave it others to possibly flesh this out but I would like to subsequentally know the critical assumptions that being made.

enter image description here

$\endgroup$

Your Answer

By clicking “Post Your Answer”, you agree to our terms of service and acknowledge you have read our privacy policy.

Not the answer you're looking for? Browse other questions tagged or ask your own question.