I've read a lot about Playfair and the history of graphics. However, I have not discovered who was the first to create the now popular yet information-poor bar graph of means. Anybody know?
-
$\begingroup$ I am not sure that this is an appropriate question. It is hard to historically trace something to its first use. People even argue about the first use of regression. Galton coined the term in the 1890s but maybe you could find in the literature someone who did it before him. $\endgroup$– Michael R. ChernickCommented Dec 31, 2016 at 17:40
-
$\begingroup$ I agree, but I would still be interested in the first use anyone can come up with. $\endgroup$– David LaneCommented Dec 31, 2016 at 19:33
-
3$\begingroup$ An earlier use of the term regression by Galton was Galton, F. 1885. Section H. Anthropology. Opening address by Francis Galton. Nature 32: 507-510. What precisely counts as the first use of regression is a deeper question as people were fitting lines and curves much earlier. $\endgroup$– Nick CoxCommented Dec 31, 2016 at 20:16
-
$\begingroup$ "the ... bar graph of means" suggests that you have a specific design in mind. Is showing a set of different means by different bars sufficient? $\endgroup$– Nick CoxCommented Dec 31, 2016 at 20:17
-
3$\begingroup$ Yes, any bar graph or graphs showing means. I have looked at some very old psychology journals and don't see bar graphs of means. However, current issues are full of them. Recently there have been a number of articles saying they shouldn't be used but these articles don't seem to have any effect. $\endgroup$– David LaneCommented Dec 31, 2016 at 20:44
1 Answer
I rather disagree that the bargraph, or specifically a bargraph of means, is information poor. Used in tandem with error bars, it can be equivalent to a forest plot to allow approximate inference and verification of consistency, as well as presenting the scale of effect so as to allow the viewer to compare effects both on a difference scale and on a log scale, depending on their perception. That's not to say that graphs cannot be used badly, and in ways I can't anticipate fully or even describe ... but to name a few,
- using truncation/omitting the origin,
- omitting a y-axis or labeling it, and/or forgetting or using the wrong units
- using superfluous dimensions like width, color, or 3-dimensions to obscure the effect of interest,
- not mentioning how means and/or SEs are calculated and whether the error bar is 1 SE or 1.96 SEs.
Those problems could be encountered in virtually any plot and serves as a reminder: it is not the tools, but their misuse, that contribute to a bad reputation. I would be interested to know how you might propose another general approach.
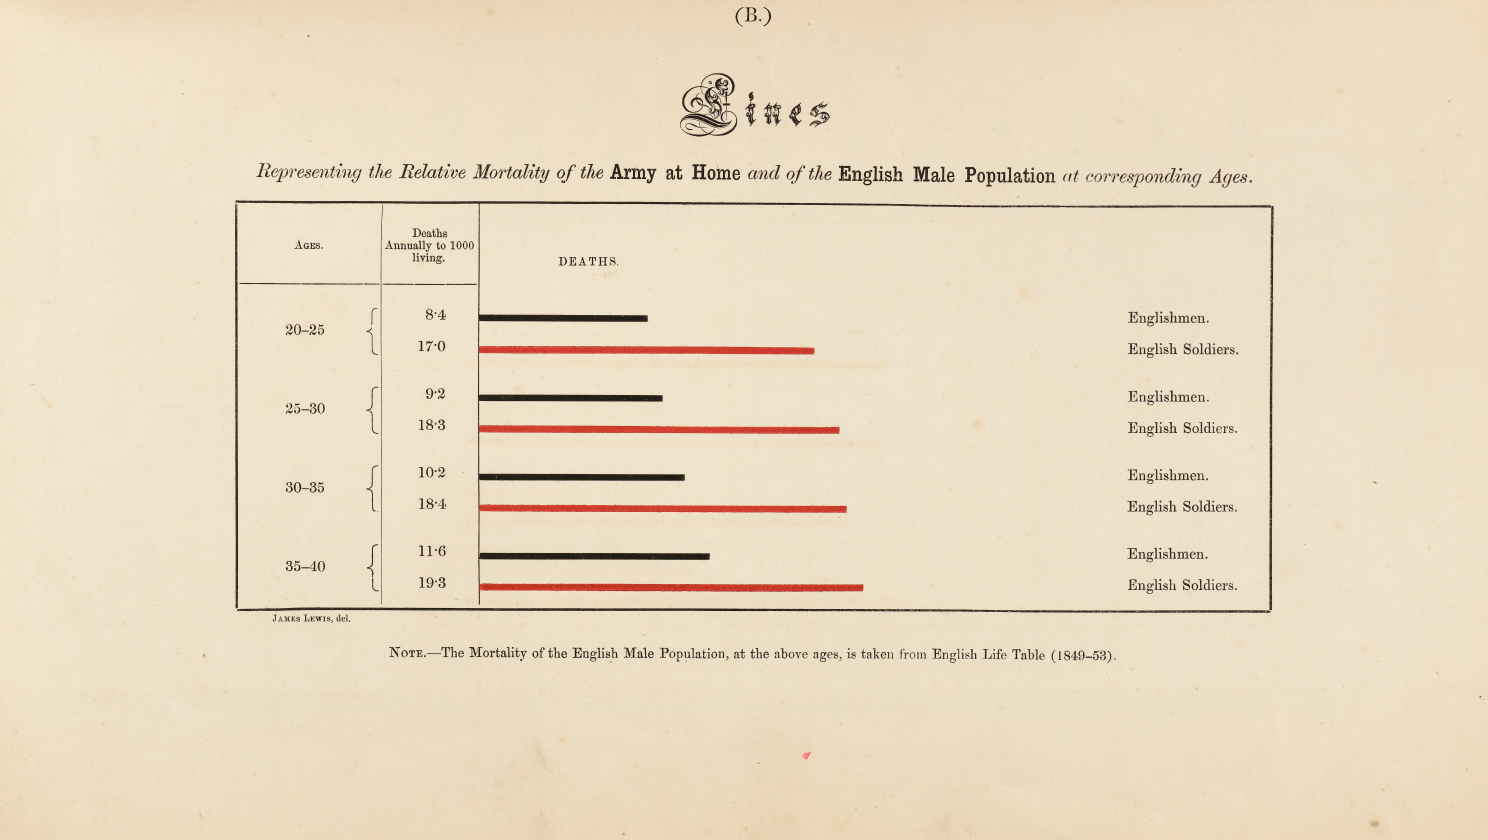
A very early example of bar graphs of means comes from Florence Nightengale who independently pioneered great dataviz tools. Here she presents death rates per 1,000 which, under a counting process like Poisson a rate is also a mean accounting for an person-year offset. This image dates to 1858. Seeing as there are no other answers, I'm almost certain an earlier verifiable source could be found, but this is one very early example to celebrate an influential figure in data visualization.
https://www.theguardian.com/news/datablog/2010/aug/13/florence-nightingale-graphics
-
3$\begingroup$ I have taken the liberty of swapping the image for a hi-res one. I hope that's OK ! $\endgroup$ Commented Oct 9 at 10:07
-
1$\begingroup$ It's great to get a concrete proposal which focuses discussion. On a different level: I would add 5) when zero is shown on such a bar chart, the design often misses the point, which is to compare results with each other, not with zero; the remedy is then not to use a bar chart at all. $\endgroup$– Nick CoxCommented Oct 9 at 11:06

