0
$\begingroup$

I have read the suggested questions that "may already have (my) answer," but don't feel they address my issue. I am not versed in statistics, so a bit more explanation to me may be necessary.

I am trying to develop a tool using Java to help me locate possible candidates from a pool of property sales data.

The number of data points for each candidate test can range from just a few (2 or 3) to about 20, though usually around 6.

I plotted the data individually for several candidates hoping to see some sort of pattern without luck, though I may have chosen improper axes.

Because I had heard of standard deviation in the past, I implemented an algorithm to compute the standard deviation for the data when there were more than 3 data points. I then kept anything that was within 1 sigma. I understand that the minimum for outliers is generally 2 sigma, however, generally all data points fall within 2 sigma (data sample below is one of few that don't).

I am concerned that my ignorance has led me to implement something that is providing me false results. It may be that I need to standardize my data points, but I don't want to just add in more math without some validation of my thought process.

So, in more concrete terms, I am trying to determine the value of a property using recent sales data. The sales data has been filtered to meet criteria related to time, distance, and size. The sales data may contain information for properties that are not comparable due to condition or other factors, which is quite commonly reflected in the sales price. I want to determine which properties in the sales data are more likely to be useful.

EDIT: I have been reading up on quantiles and other statistics mathematics. I have learned that equation R-8 on the Wikipedia article on quantiles is considered best to use by Hyndman and Fan. I believe I have implemented the correct computation of Q(0.75) for use in MAD with b = 1/Q(0.75). Using MAD (2 or 3), I am more often than not left with only one inlier in each of my datasets (corresponding to the median of the absolute deviations), regardless of size. This seems unlikely to be correct to me.

EDIT 2: SAMPLE DATA: 166.5833333, 96.82416731, 153.7698413, 160.5995717, 157.1428571, 147.2727273, 157.0458404, 145.8111314, 193.438914, 231.0717797, 95.20264682, 133.3333333, 145.4234388, 105.8333333, 196.5690377, 196.9972702, 164.4359465 INTERMEDIATE RESULTS: median=157.0458404, h= 13.33333333, Q(.75)=175.5351936, b=0.005696863, MAD=11.62240157, b*MAD=0.066211233, MAD2 Range = 156.913417941812, 157.178262873129 RESULTS: inliers = 157.1428571,157.0458404

I think I may be using the b*MAD improperly.

$\endgroup$
4
  • $\begingroup$ Are you looking for outliers that are extremely large, extremely low or both? $\endgroup$ Commented Feb 11, 2017 at 16:11
  • $\begingroup$ @MichaelChernick am looking for both outliers. $\endgroup$
    – Todd
    Commented Feb 11, 2017 at 16:32
  • $\begingroup$ Can you use residual plot? $\endgroup$
    – SmallChess
    Commented Feb 11, 2017 at 17:59
  • $\begingroup$ @StudentT I don't know. If that requires one to look at a plot to determine outliers, then I don't think so. This is an automated process. $\endgroup$
    – Todd
    Commented Feb 11, 2017 at 18:56

1 Answer 1

1
$\begingroup$

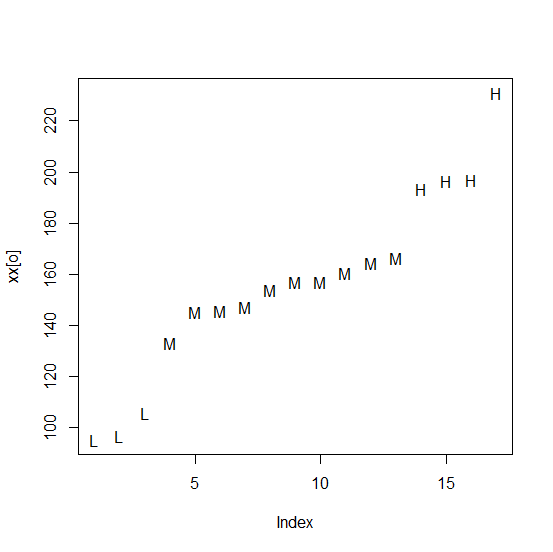
Consider clustering the data into three groups: Low, Medium and High. Now assuming input xx, as in the Note at the end of this answer, and using the R package RWeka (which is an interface to the underlying java-based Weka code) we have that xx[i] is associated with the group whose center, i.e. average value, is centers[i] and whose L/M/H level is lev[i].

library(RWeka)

skm <- SimpleKMeans(xx, list("-N", 3))
centers <- ave(xx, skm$class_ids)
lev <- factor(centers, labels = c("L", "M", "H"))

We can check graphically that this assignment does make sense:

o <- order(xx)
plot(xx[o], pch = as.character(lev)[o])

screenshot

Note: We used this input:

xx <- c(166.5833333, 96.82416731, 153.7698413, 160.5995717, 157.1428571,     
147.2727273, 157.0458404, 145.8111314, 193.438914, 231.0717797, 95.20264682, 
133.3333333, 145.4234388, 105.8333333, 196.5690377, 196.9972702, 164.4359465)
$\endgroup$
3
  • $\begingroup$ Thanks for the answer. Unfortunately, I will need to spend some time learning R just to understand what you are trying to impart to me. Once I find the time to learn R, I will return to this answer. $\endgroup$
    – Todd
    Commented Feb 12, 2017 at 3:02
  • $\begingroup$ I looked at the plot and assumed that you are suggesting that the low and high clusters be ignored as outliers. If that is the case, this result matches the result when computing the standard deviation and eliminating anything greater than 1 sigma as I described above. My concern is that the data is likely not Gaussian, so is this technique valid? $\endgroup$
    – Todd
    Commented Feb 12, 2017 at 3:17
  • 1
    $\begingroup$ kmeans clustering is not based on a statistical model so the notion of being valid or not is just a matter of whether it gives answers you like or not. Test it out on a sufficiently large number of samples. The underlying Weka software is written in Java, not R. Follow the link provided. $\endgroup$ Commented Feb 12, 2017 at 12:28

Your Answer

By clicking “Post Your Answer”, you agree to our terms of service and acknowledge you have read our privacy policy.

Not the answer you're looking for? Browse other questions tagged or ask your own question.