This is really puzzling...
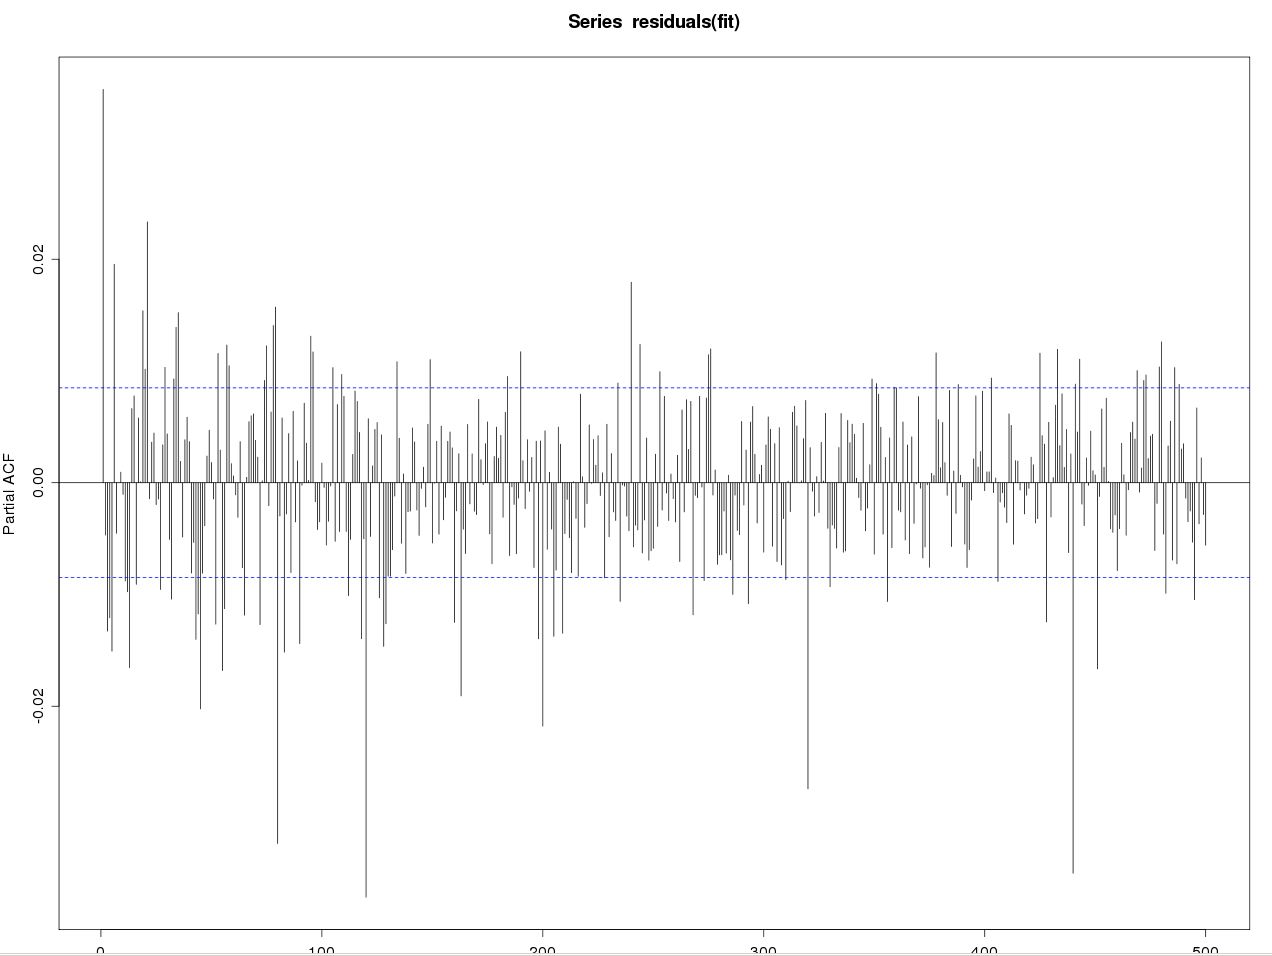
I have this data which has a lot autocorrelations...
The data is about 60000 data points of 15min data.
I tried fitting it to ARIMA(6, 0, 6) and even GARCH(1, 1) with mean model ARMA(6, 6), still there are lots of autocorrelations in the residuals.
 I almost wanted to try ARIMA(100,0,100), but I think even that is not enough...
I am doing these in R.
How to I get out this swamp? Please shed some lights on me.
Thanks so much
Update: I have fitted a gjrGARCH model with distribution "sstd" in R using "rugarch" package...
QQ-Plot of Standardized Residuals looks great - it's a straight line...
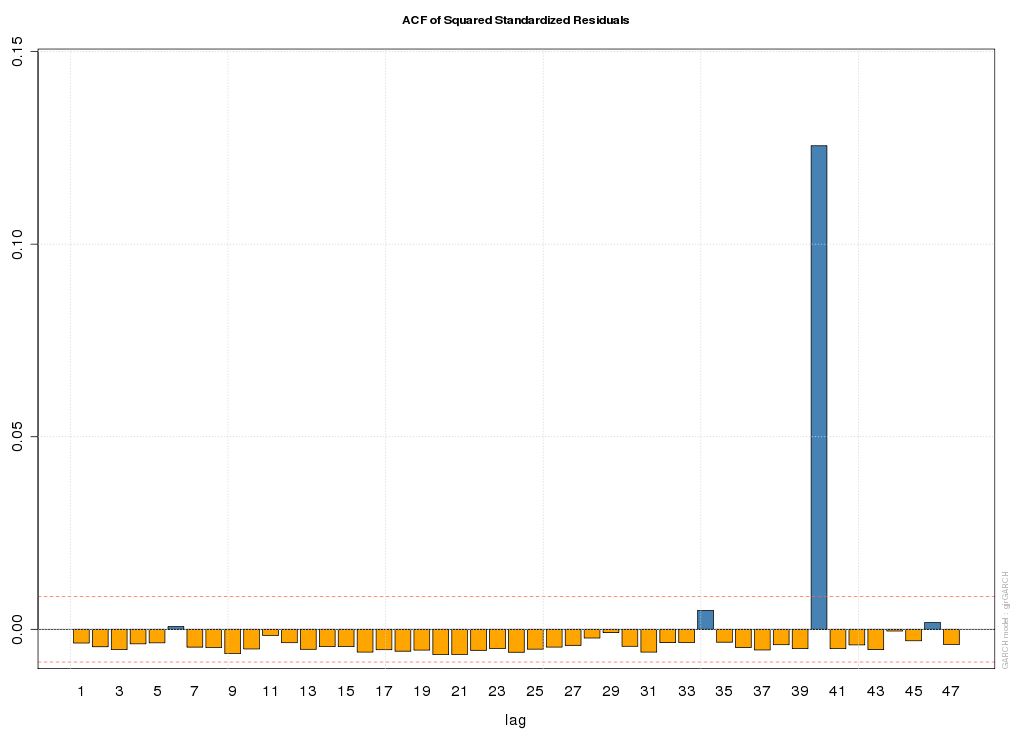
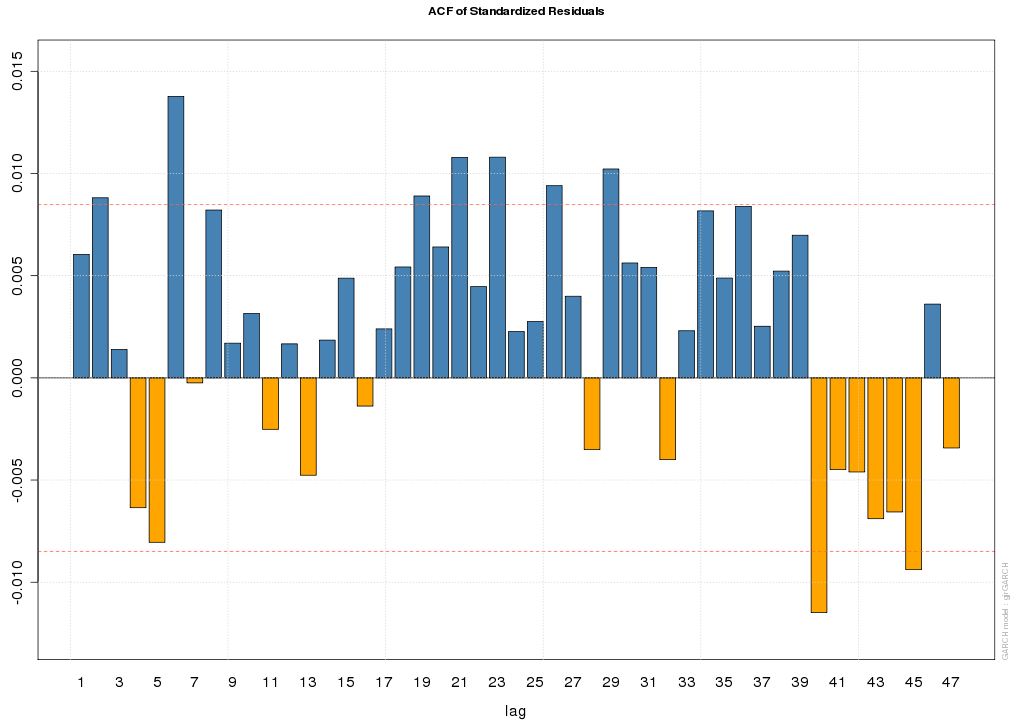
However the ACF plots of the residuals and the residuals squared are a bit strange, especially the big spike in the residual squared ACF plot.
Could anybody please shed some lights on us, esp about that big spike?
Thank you!


