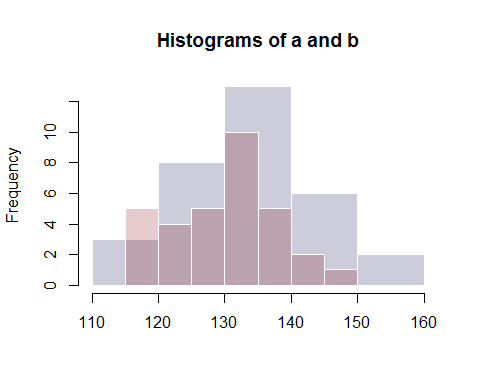
I am fairly new to stats and have read up on the Mann-Whitney U-test but I still am facing an issue I can't resolve. I have two independent samples:
a = (110, 115, 128, 142, 123, 129, 130, 128 ,134, 133, 128, 147, 137, 112, 138, 128, 132, 139, 133, 135, 133, 125, 134, 139, 138, 142, 152, 140, 144, 147 ,153 ,141)
b = (122, 118, 120 ,131 ,124 ,118 ,120 ,140 ,124, 120, 134, 127, 127 ,134, 133, 137 ,137 ,135 ,129 ,138 ,143, 128 ,121 ,129, 133, 138, 142, 131, 135, 132, 146, 135)
The null hypothesis states that a and b have similar distributions (or rather medians). When individually tested, I get a p-value(0.106) higher than 0.05, which indicates I should accept my null hypothesis. But on manual checking, it shows the medians are different. Following is the code:
>a = c(110, 115, 128, 142, 123, 129, 130, 128 ,134, 133, 128, 147, 137, 112, 138, 128, 132, 139, 133, 135, 133, 125, 134, 139, 138, 142, 152, 140, 144, 147 ,153 ,141)
>b = c(122, 118, 120 ,131 ,124 ,118 ,120 ,140 ,124, 120, 134, 127, 127 ,134, 133, 137 ,137 ,135 ,129 ,138 ,143, 128 ,121 ,129, 133, 138, 142, 131, 135, 132, 146, 135

>wilcox.test(a,b)
Wilcoxon rank sum test with continuity correction

data:  c and d
W = 632.5, p-value = 0.1067
alternative hypothesis: true location shift is not equal to 0
I am not sure why this is happening. Any help is appreciated. Thanks!

