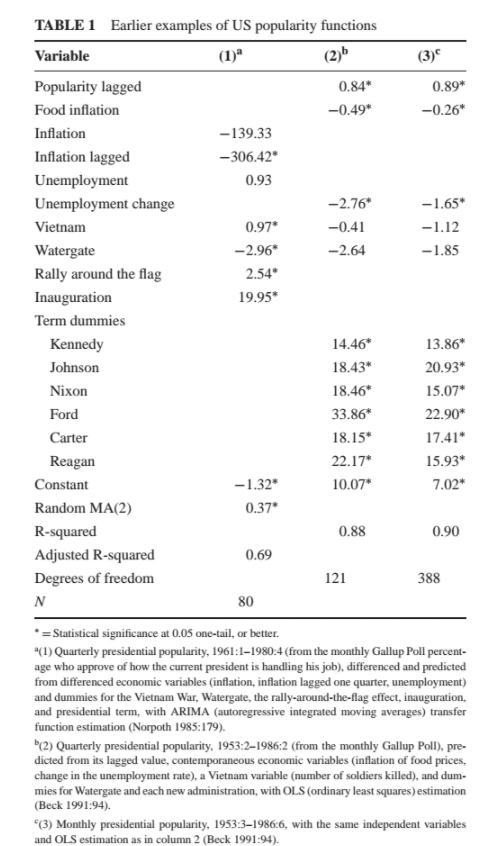
I'm reading through a paper on economic factors and how they pertain to elections. Unfortunately I don't remember enough stats to fully understand how to read the tables being presented. Here is a sample...
"Data are aggregate time series gathered over the post-World War II period. The percentage of the public approving of how the president is handling his job, according to a Gallup poll, is the variable to be explained. The independent variables beside the economy are war, political scandal, international crisis and term cycles. Examples of such a model appear in Table 1..."
At first I thought the values being represented were the number of percentage points each variable was responsible for. But -306% doesn't seem to make sense in that regard? I'm also unclear what the "Term dummies" category is for.
My questions are --
1) If possible, I'd love to get a primer on what the data in this table represents
and
2) A pointer towards what type of stats study I should do to better understand what is going on here.
Thanks!

