4
$\begingroup$

I want to compare distributions of reads of a particular length across two different genes and test whether they are statistically different from each other.

For example, if we have the read counts for each category as a list.

gene1 = [140, 280, 122, 544, 681, 1461, 457, 10660, 1133, 770, 
         5903, 716, 9209, 2828, 2192, 4647, 1027, 1129, 2407, 
         292, 852, 851, 136, 392]

gene2 = [ 5, 4, 20, 8, 701, 221, 233, 480, 305, 1062, 424, 1023, 
         474, 1071, 363, 279, 319, 64, 1240, 55, 79, 163, 6, 24]

The list index is the category (read length) and it is corresponding to index in the other list. As you can see, the read count (frequency in each category) can differ greatly between the two genes for each category.

If I apply a chi-square test of independence, it results in a very high chi-square statistic due to huge difference in frequencies of corresponding categories. Also there can be instances where frequency is less than 5. Hence I seriously doubt the validity of applying this test.

I wanted to know if there is any better way to compare these distributions?

I can calculate proportions within each category (to normalize to same scale) but I am not sure how I compare them between the two distributions.

Edit: Why is it problematic?

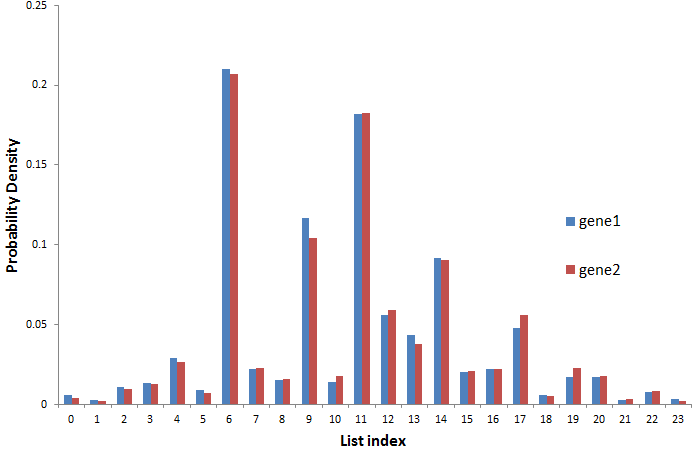
The distributions of the two sets are very similar but the magnitude of counts are very different where a negligible difference in probability density is a very high difference in actual counts and hence chi-sq is very high leading to significant p-value when I expect it to be insignificant.

enter image description here

View post on imgur.com
$\endgroup$
2
  • 4
    $\begingroup$ It's not clear to me why you doubt the validity. Note that it's not frequency below 5 that's the issue, but expected frequency. What proportion of categories have expected frequency below 5? $\endgroup$
    – Glen_b
    Commented Sep 20, 2017 at 3:00
  • 2
    $\begingroup$ Adding to what @Glen_b wrote seven years ago: your problem is that your intuition shouldn't override the facts. The counts are so large that even relatively small differences cannot be attributed to chance. These distributions are indeed "statistically different." Maybe you should be asking a different set of questions: namely, how do they differ and by how much? $\endgroup$
    – whuber
    Commented Sep 23 at 22:13

1 Answer 1

0
$\begingroup$

Pearson's Chi-Square test would work best for large sample sizes, where the limiting distribution of the test-statistic is Chi-Square. In your case, for 24 observations, there are other (better) alternatives you can explore.

The Kolmogorov-Smirnov test is one of the most useful nonparametric tests for comparing two sampling distributions. K-S tests are particularly very powerful for continuous data, where the assumption that the K-S statistic (which is a distance metric between the two empirical CDFs) converges asymptotically to the Kolmogorov distribution if F is continuous. Again, both the large sample size and the discretization of your distribution are points which may invalidate the conditions necessary for the K-S test.

Permutation tests are especially powerful in overcoming the obstacles in performing K-S test and Pearson's test. Permutation tests (or Randomization tests) very much have the flavour of the Bootstrap - as it resamples the data. But, unlike the Bootstrap permutations of the data are used instead of resampling with replacement. The added flexibility here is that you can measure the deviation between the two distributions using any distance metric (e.g. the K-S statistic itself, difference in medians or ratio of means, etc.). This is fairly simple to implement in any programming framework.

Alternatively, you can just run two-sample bootstrap test using a distance metric between the two distributions and test your hypothesis.

Ultimately, it will boil down to the methodology you are comfortable with and your assessment of the applicability of underlying assumptions associated with each methodology.

$\endgroup$
5
  • 4
    $\begingroup$ KS might be suitable if the categories are inherently ordered; it's not clear to me that this is the case $\endgroup$
    – Glen_b
    Commented Sep 20, 2017 at 2:19
  • $\begingroup$ I agree. Looks like a Permutation Test using a distance metric (which OP can decide based on the nature of his data) should be the most plausible alternative to Pearson's test. $\endgroup$
    – SidV
    Commented Sep 20, 2017 at 2:44
  • 1
    $\begingroup$ Thanks. Permutation test seems most plausible. I was thinking of using KL or JS distances but sometimes my entries can be zeros. I am thinking of using Bhattacharya distance or Hellinger distance which I hope should overcome this limitation. $\endgroup$ Commented Sep 20, 2017 at 13:47
  • $\begingroup$ Bhattacharyya and Hellinger are great distance metric choices for your analysis. Personally, I would prefer the Wasserstein distance - which has become popular in EECS literature where it's used for computer vision, and signal processing. It is also very conducive for analysis with discrete distributions. $\endgroup$
    – SidV
    Commented Sep 22, 2017 at 22:38
  • $\begingroup$ I have tried Permutation test but I think the same problem is occurring. This is something like Law of Large numbers. When we have such huge number of instances, after permutation, the count/proportion in the two sets are becoming equal leading to a statistical distance of near zero between the two distributions after permutation. Hence even a permutation test with the actual number of counts is giving me a significant p-value when visually the distribution is very similar. When the numbers are scaled to 100, they give me expected value. So I am back to square one. $\endgroup$ Commented Sep 25, 2017 at 23:56

Your Answer

By clicking “Post Your Answer”, you agree to our terms of service and acknowledge you have read our privacy policy.

Not the answer you're looking for? Browse other questions tagged or ask your own question.