5
$\begingroup$

Given a point $x$ lying on the surface of a n-sphere $S$, what is an efficient way of randomly sampling points $x_k \in S$ such that their distance from $x$ is at most $r$? ($\|x-x_k\| < r$)

Can this be done uniformly?

I have efficient ways of converting cartesian coordinates to n-spherical coordinates and back.

$\endgroup$

2 Answers 2

6
$\begingroup$

Sample in a neighborhood of $e_{n+1}=(0,0,\ldots,0,1)$ in $\mathbb{R}^{n+1}$ and then apply any orthogonal transformation (that is, isometry of the sphere) that sends $e_{n+1}$ to $x_k$. This reduces the problem to sampling around $e_{n+1}$.

Geometry shows that the last coordinate of the points, $Z$, will range from $1$ down to $1 - r^2/2$. The distribution of $Z$ is otherwise that of a Beta$(n/2,n/2)$ variate, multiplied by $2$ and shifted down by $1$, as shown at https://stats.stackexchange.com/a/85977/919. Conditional on $Z$, the other $n$ coordinates will lie on a sphere of dimension $n-1$ and radius $\sqrt{1-Z^2}$. Generate these using any of the methods described at How to generate uniformly distributed points on the surface of the 3-d unit sphere? (or otherwise).

To draw values of $Z$, compute the quantile associated with $1-r^2/2$. If $F$ is the Beta$(d/2,d/2)$ distribution function, this will be $F^{-1}(r^2/4)$. For $U$ a uniform variate in $[0, F^{-1}(r^2/4)]$, set $Z=1-2*F(U)$.

Here is R code to illustrate the ideas (and fill in any details I might not have explained sufficiently clearly). Tests of $S^1$ and $S^2$ (which can be directly visualized) and of higher-dimensional spheres with very small distances and the maximum distance ($2$) are consistent with what one would expect, suggesting it is working correctly.

d <- 2       # Dimension of the sphere; one less than dimension of its Euclidean space.
n <- 1e3     # Number of points to generate.
r.max <- 0.2 # Maximum Euclidean distance.
#
# Generate uniformly random points on a `dim`-sphere of radius `radius`.
# Returns (dim+1)-dimensional vectors as rows.
#
rsphere <- function(n, dim, radius=1) {
  x <- matrix(rnorm((dim+1)*n), nrow=n)
  x / (sqrt(rowSums(x^2)) / radius)
}
#
# Generate random heights on the d-sphere.
#
q <- pbeta(r.max^2 / 4, d/2, d/2)           # Limiting quantile
z <- 1 - 2*qbeta(runif(n, 0, q), d/2, d/2)  # Last coordinate
#
# Compute the corresponding radii of the cross-sections at heights `z`.
#
rho <- sqrt(1 - z^2)                        # Radius
#
# Generate the remaining (first `d`) coordinates uniformly.
# Results are in the rows of `x`.
#
x <- cbind(rsphere(n, d-1, radius=rho), z)

Incidentally, it's simple and fast to find an orthogonal transformation of $\mathbb{R}^{n+1}$ that sends $e_{n+1}$ to $x_k$: choose the reflection with this property. Here is sample R code to apply such a reflection to an entire array of coordinates, such as the x produced above.

#
# Reflect points `x` (array of rows) in a way that sends (0,0,..,0,1) to `target`.
#
reflect <- function(x, target) {
  if (!is.matrix(x)) x <- matrix(x, nrow=1)
  n <- length(target)
  v <- c(rep(0, n-1), 1) - target
  v.norm2 <- sum(v^2)
  return(x - outer(2/v.norm2 * c(x%*%v), v))
}
$\endgroup$
4
  • $\begingroup$ Any sources on constructing orthogonal transformations? or where this particular transformation is from? $\endgroup$
    – beangoben
    Commented Nov 16, 2017 at 9:10
  • $\begingroup$ @BenjaminSanchezLengeling Various threads discuss generating orthogonal transformations, such as stats.stackexchange.com/questions/215497. What "particular transformation" are you referring to here? $\endgroup$
    – whuber
    Commented Nov 16, 2017 at 15:27
  • $\begingroup$ sorry, should have clarified that I meant orthogonal transformations that map one point to another. Was able to understand the arguments and code on sampling. But on the reflection transformation, was not clear where the formulas came from, also since I not so acostumed to R code. I have python code for the previous snippets that I intend to add to your answer once I verify they work. $\endgroup$
    – beangoben
    Commented Nov 16, 2017 at 17:31
  • $\begingroup$ @Benjamin, all orthogonal transformations are generated by reflections. The reflection that sends a point $p$ to a point $q$ is the reflection through the hyperplane that bisects line segment $pq$ perpendicularly. Equivalently, you can decompose any point $x$ into a component along vector $v=pq$ and a component perpendicular to it. All you have to do is negate the $pq$ component; equivalently, subtract twice the $pq$ component from $x$. That is what the last line of reflect does to each row of x. $\endgroup$
    – whuber
    Commented Nov 16, 2017 at 19:23
1
$\begingroup$

Adding to @whuber's answer here is python code to reproduce the ideas he explained, as well to validate the results.

from scipy.stats import beta
import numpy as np

def rsphere(n,n_dim,rad=1.0):
    X = np.random.normal(size=(n,n_dim+1))
    X_norm=np.divide(np.linalg.norm(X,axis=1),rad)
    X = np.divide(X.T,X_norm).T
    return X

def reflect(X, target):
    n_dim = X.shape[1]
    pole = np.array([0]*(n_dim-1) + [1])
    v = pole - target
    X_new = X - np.outer(2.0/np.dot(v,v) * np.matmul(X,v).T, v)
    return X_new


r_max=0.5 # max radius to sample
n_dim=200 # number of dimension of the space
n_sphere=n_dim-1 # dimension of the n-sphere
n = int(1e3) # numer of points to sample

target = np.zeros(n_dim) # target
target[-2]=1 
pole = np.array([0]*(n_dim-1) + [1]) # north pole

# generate points
X = rsphere(n,n_sphere,rad=1.)
rads = np.random.uniform(0.0,r_max,n)
q = beta.cdf(np.square(rads)/4.0, n_sphere/2.0, n_sphere/2.0)
unif = np.random.uniform(0,q,n)
z = 1 - 2*beta.ppf(unif, n_sphere/2.0, n_sphere/2.0)
rho = np.sqrt(1.0 - np.square(z))
X_pole = np.hstack((rsphere(n, n_sphere-1, rad=rho),z.reshape(-1,1)))
X_nei = reflect(X_pole, target)

To validate results we can look at a histogram of distances of the generated points vs the target:

import matplotlib.pyplot as plt
X_dist = np.linalg.norm(X_nei-target,axis=1)
plt.hist(X_dist)
plt.xlabel('$\|z_i-z_{target} \|$')
plt.show()

Distribution of distances And to visualize the 3D case:

from mpl_toolkits.mplot3d import Axes3D
import matplotlib.pyplot as plt
fig = plt.figure()
ax = fig.gca(projection='3d')
ax.set_aspect('equal')
# Create a sphere
r = 1
pi = np.pi
cos = np.cos
sin = np.sin
phi, theta = np.mgrid[0.0:pi:40j, 0.0:2.0*pi:40j]
x = r*sin(phi)*cos(theta)
y = r*sin(phi)*sin(theta)
z = r*cos(phi)
# sphere
ax.plot_surface(
    x, y, z,  rstride=1, cstride=1, alpha=0.25, linewidth=0)
# pole
ax.scatter(X_pole[:,0],X_pole[:,1],X_pole[:,2],c='b',alpha=0.5)
ax.scatter(pole[0],pole[1],pole[2],s=40,c='k')
# target
ax.scatter(X_nei[:,0],X_nei[:,1],X_nei[:,2],c='r',alpha=0.5)
ax.scatter(target[0],target[1],target[2],s=40,c='k')
plt.show()
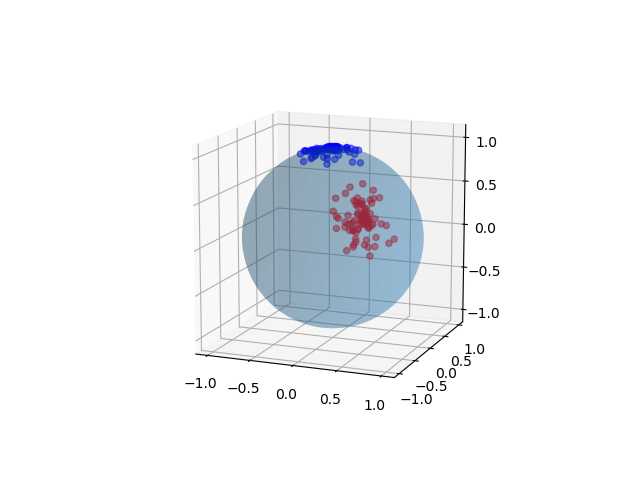
Sphere sampling

$\endgroup$

Your Answer

By clicking “Post Your Answer”, you agree to our terms of service and acknowledge you have read our privacy policy.

Not the answer you're looking for? Browse other questions tagged or ask your own question.