8
$\begingroup$

I'd like to generate a random square matrix such that the rows are normalized to one and the diagonal elements are the maximum of their column. If there an efficient way to sample these matrices uniformly?

$2 \times 2$ matrices are straightforward to create. The first column is generated by sampling two independent uniforms from $[0,1]$ and moving the maximum to the first entry. The second column is then the complement of the first. My attempts to follow an analogous procedure in higher dimensions feel very ad-hoc, and most troublesomely, give a very different distribution for the final complemented column than the others. Is some type of rejection sampling going to be my best bet?

The motivation is to generate likelihood matrices, with the rows being states of the world and columns being observed signals. Each signal is most likely to occur in its corresponding state, but isn't necessarily the most likely signal in that state.

Edit: The exact distribution doesn't matter, other than it seem natural. I would like to avoid the diagonal also being maximal for the rows though.

Here is my own previous ah-hoc attempt.

gen.likelihood.matrix <- function(T){
    # T: Number of states

    mat <- matrix(runif(T^2), nrow=T) # Intialize with uniform variates
    diag(mat) <- 1 # To guarantee diag is max in column

    candidate.mat <- matrix(nrow=T, ncol=T)
    # Loop to check for constraint satisfaction
    for(k in 1:100){
        weights <- runif(T-1)
        weights <- weights / sum(weights)

        for(i in 1:T){
            # Rescale columns
            candidate.mat[i,-T] <- mat[i,-T] * weights
            # Replace last column with complement to meet row constraint
            candidate.mat[i,T] <- 1 - sum(candidate.mat[i,-T])
        }

        # Does the last column meet the maximality constraint?
        if(candidate.mat[T,T] > max(candidate.mat[-T,T])){
            # Shuffle to minimize the distortion from last column
            reorder <- sample(1:T,T)
            return(candidate.mat[reorder,reorder])
        }
    }

    # Recurse to get new initial values if necessary
    return(genLikeliMatrix(T))
}

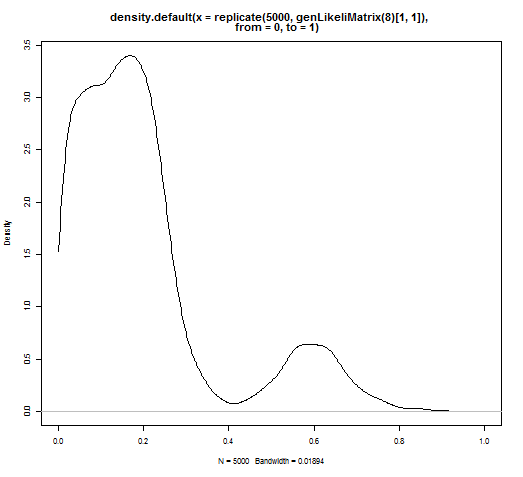
This works in terms of giving me matrices efficiently, but I get a weird bimodal distribution on the diagonal due to how I handle the last column. Distribution of diagonal elements
$\endgroup$
14

5 Answers 5

5
$\begingroup$

OK, to move these efforts along (but with some diffidence) I offer this approach: generate the diagonal elements first. Make them large constants. Generate all off-diagonal elements iid according to any (non-negative) distribution you want. Normalize rows. Check the column-max condition. Repeat if violated.

By making the initial constants sufficiently large, the expected number of repetitions can be made small.

Clearly the diagonal elements are iid, the non-diagonal elements are iid, but (of course) the two distributions differ.

Here's some code to play with.

n <- 8                                     # Matrix dimension
y <- rep(1 + 3/sqrt(n),n)                  # A large constant compared to entries in x
x <- matrix(runif(n^2), ncol=n)            # Here, uniform distributions off diagonal
x[cbind(1:n,1:n)] <- y                     # (Paste in the diagonal)
z <- t(apply(x, 1, function(u) u/sum(u)))  # Normalize the rows
which(1:n != apply(z, 2, which.max))       # Find all columns violating the conditions

(One hopes for integer(0) as the output; otherwise, indexes of columns whose maxima are not diagonal will be output.) I have experimented with n ranging from 3 through 300.

It's instructive to plot the columns:

plot(z[1,], type="n")
apply(z, 2, function(u) lines(u, col=(256*runif(1))))
$\endgroup$
1
  • 2
    $\begingroup$ Normalizing the rows faster and cleaner: z <- x/rowSums(x) $\endgroup$
    – cardinal
    Commented Jun 8, 2012 at 20:27
3
$\begingroup$

First, I would generate a matrix $M$ such that $M_{ij}$ is exponentially distributed with mean $\mu$ for all $i \ne j$ or $0$ otherwise.

Then, calculate your matrix \begin{align} X_{ij} &= \frac{e^{-M_{ij}}}{\sum_je^{-M_{ij}}} \end{align}

To efficiently sample from a categorical distribution (a list of probabilities totalling 1), just build a Huffman tree using the probabilities of each outcome keeping track of the total probability in descendants to the left of each node. Sample from a uniform distribution, and find the leaf node whose cdf is the smallest one larger than your sampled value. (This has an amortized cost of the entropy of your categorical distribution.)

$\endgroup$
1
  • 2
    $\begingroup$ This guarantees the diagonal elements are maximal in the columns, but normalizes across the columns rather than the rows. If the normalization is done across rows, then the maximality condition is usually not satisfied. I don't want the diagonal to be maximal in the rows generally, only in the columns. $\endgroup$ Commented Jun 8, 2012 at 20:00
1
$\begingroup$

Just generate each row from a Dirichlet distribution then reorder if needed to put the largest value on the diagonal (or choose the parameters such that the largest is likely to be on the diagonal).

$\endgroup$
1
  • 2
    $\begingroup$ As noted in the question and in comments to other answers, the OP wants the rows to sum to one, but the diagonal to be maximal in its respective column. Your parenthetical comment paired with a rejection sampling scheme and independently distributed rows seems like a little more promising approach depending on the dimensionality of the problem. $\endgroup$
    – cardinal
    Commented Jun 8, 2012 at 20:17
1
$\begingroup$

Essentially the same idea of whuber, this time using Dirichlets: the lines of the matrix are independent Dirichlets, with each Dirichlet putting more mass on the corresponding diagonal element.

rdirichlet <- function(a) {
    x <- sapply(a, function(a) rgamma(1, a, 1))
    return(x / sum(x))
}

n <- 5
A0 <- 10
a <- matrix(data = 1, nrow = n, ncol = n)
diag(a) <- A0
x <- matrix(nrow = n, ncol = n)
for (i in 1:n) x[i,] <- rdirichlet(a[i,])

Reject if x does not satisfy the constraints. If the rejection rate is too high, increase the value of A0. Here is a sample x.

> x
            [,1]       [,2]       [,3]       [,4]        [,5]
[1,] 0.484437196 0.03511667 0.04919437 0.12718905 0.304062711
[2,] 0.008626386 0.76520244 0.03231747 0.02454215 0.169311552
[3,] 0.176631389 0.01971251 0.55780424 0.07952712 0.166324747
[4,] 0.003109732 0.12056624 0.09335086 0.77330892 0.009664246
[5,] 0.037015097 0.02485376 0.04536731 0.05083834 0.841925490

P.S. Please, vectorize that pesky for.

$\endgroup$
2
  • 2
    $\begingroup$ Please, vectorize that pesky for. Ok. How's this? x <- matrix(rgamma(prod(dim(a)),a),ncol(a)); x <- x / rowSums(x) $\endgroup$
    – cardinal
    Commented Jun 10, 2012 at 0:28
  • $\begingroup$ It doesn't matter in this case but the ncol(a) should have been nrow(a) or nc=ncol(a) (either of the last two being equally valid). $\endgroup$
    – cardinal
    Commented Jun 10, 2012 at 2:30
0
$\begingroup$

First generate random rows then divide each row by its sum so you get them to sum to one. Then order the rows a particular way, in the first row you want the row that contains the element in its first position that is the max of column 1. So, in the nth row you want the row that has the max of the nth column.

$\endgroup$
1
  • 3
    $\begingroup$ The problem is that the row with the maximum of the first column might also have the maximum of one of the other columns. This might be a starting point for rejection sampling, but I'm wondering if a more direct way exists. $\endgroup$ Commented Jun 8, 2012 at 17:13

Your Answer

By clicking “Post Your Answer”, you agree to our terms of service and acknowledge you have read our privacy policy.

Not the answer you're looking for? Browse other questions tagged or ask your own question.